Your attribution model might be misleading your budget decisions. Without proper validation, you risk overcrediting some campaigns (like last-click ads) while undervaluing others, leading to wasted spend and poor ROI. This guide outlines a simple checklist to ensure your attribution model is accurate, reliable, and aligned with your business goals.
Key Steps for Validation:
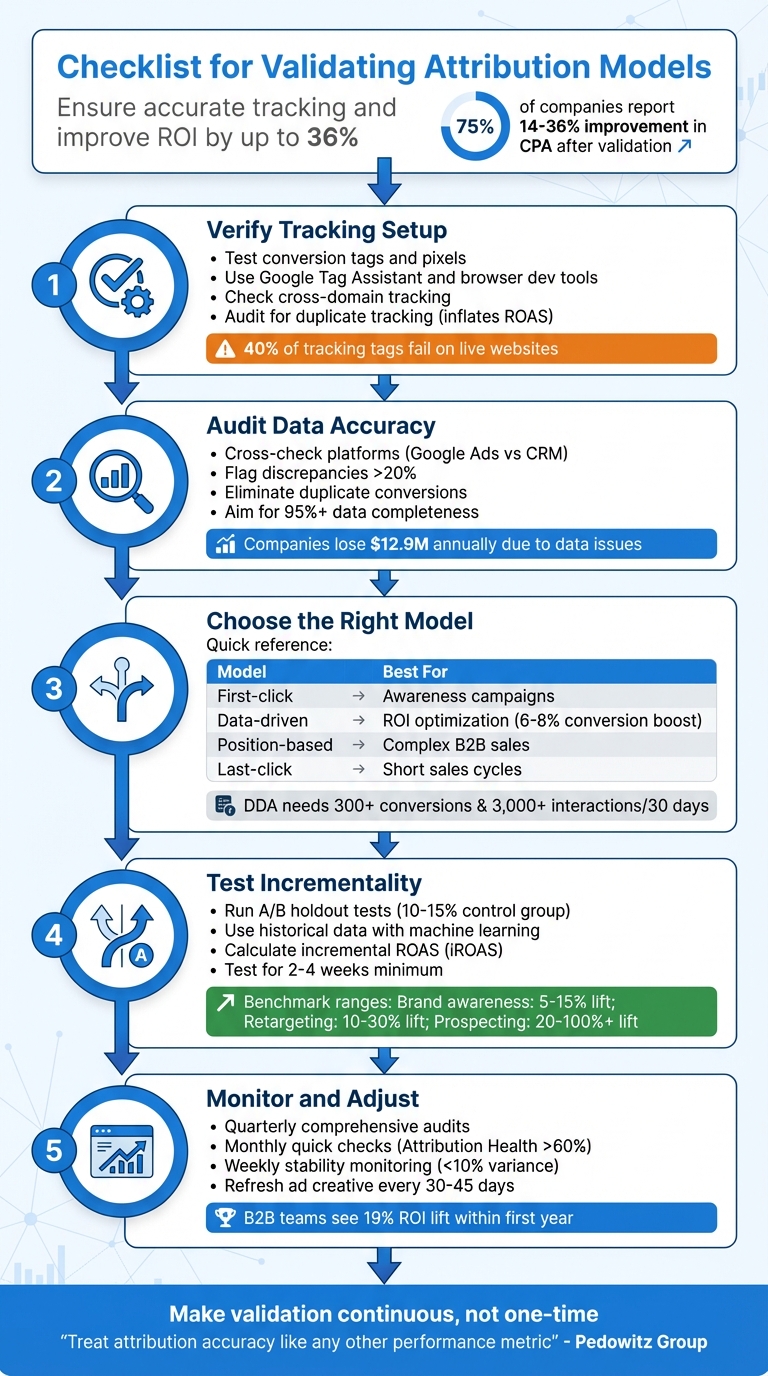
- Verify Tracking Setup: Ensure conversion tags and pixels are firing correctly. Use top PPC tools like Google Tag Assistant and test full conversion paths, including cross-domain tracking.
- Audit Data Accuracy: Cross-check data between platforms (e.g., Google Ads vs CRM). Address discrepancies, eliminate duplicate conversions, and recover missing data with enhanced tracking.
- Choose the Right Model: Match your model to your business goals:
- First-click for awareness.
- Data-driven for ROI.
- Position-based for complex sales.
- Test Incrementality: Run A/B holdout tests or use historical data to measure if campaigns truly drive conversions or just claim credit.
- Monitor and Adjust: Conduct regular audits, track performance changes, and refine attribution rules as your campaigns evolve.
Why it matters: Companies that validate attribution models report up to a 36% improvement in CPA and a 19% ROI lift within a year. Start with these steps to make informed budget decisions and improve your campaign performance.
5-Step Attribution Model Validation Checklist for Marketing Teams
Validating and Calibrating Marketing Attribution: Practical Guide to Using MMM and Testing
sbb-itb-89b8f36
Verify Technical Tracking Setup
Before you can trust your attribution model, you need to ensure your tracking setup is solid. Reliable custom attribution depends on a strong technical foundation. Yet, nearly half of all Google Ads accounts lack proper conversion tracking, leading to billions of dollars in misattributed ad spend. On top of that, as many as 40% of tracking tags fail on live websites, creating major blind spots in your data.
David Pombar, Digital Analytics Expert at Trackingplan, puts it bluntly: "Failing to test your tags properly is like trying to navigate a ship with a broken compass. You're moving, but you have no reliable way of knowing if you're actually heading in the right direction".
Check Conversion Tags and Pixels
Start by opening your browser's developer tools. Head to the Network tab and filter for platform-specific requests (e.g., collect?v=2 for GA4, or terms like "facebook" or "bing"). Examine the payload to confirm that event names (en), URLs (dl), and custom parameters (ep.) are transmitting as expected.
Browser extensions like Google Tag Assistant, Meta Pixel Helper, and Microsoft UET Tag Helper can help you spot errors in real time. Additionally, check the dataLayer variables in your browser console to ensure they populate correctly before the tags fire.
In Google Ads, navigate to the Conversions section (Tools & Settings > Measurement > Conversions) and review the Status column. Look for alerts like "Needs Attention" or "Inactive", as these indicate technical issues that need immediate resolution. Also, audit for duplicate tracking methods - if tags fire twice on the same conversion page, it can inflate your ROAS and skew ROI calculations.
Once you've verified the tags, test the entire conversion process to ensure everything works smoothly from start to finish.
Test Complete Conversion Paths
Manual testing can catch problems that automated tools might miss. Try the "Three Real Journeys" test: simulate conversions on desktop, mobile, and as a returning user. Use Incognito mode or clear your cookies before each test to mimic a fresh user session.
While testing, confirm that the Google Click Identifier (GCLID) remains intact through redirects, landing pages, and form submissions. If your campaigns span multiple domains - like a main site and a separate checkout domain - make sure the "linker" parameter is active to avoid breaking attribution. Wait about two hours for the data to propagate before reviewing reports.
Use Google Tag Manager's Preview Mode to monitor the event timeline and confirm that tags fire on the correct triggers. For example, a tag set to fire on "Window Loaded" instead of "DOM Ready" might miss critical dataLayer pushes, resulting in incomplete tracking. If you notice data discrepancies greater than 10% between platforms, it’s time to investigate.
Once conversion paths are confirmed, shift your focus to enhanced and server-side tracking.
Validate Enhanced and Server-Side Tracking
Enhanced conversions and server-side tracking help recover data lost due to ad blockers and privacy restrictions. These methods can boost reported conversions by 10% to 30%, while enhanced conversions alone can recover 15% to 25% of conversions lost to cookie limitations.
For Enhanced Conversions in Google Ads, ensure that first-party data (like email addresses or phone numbers) is hashed using SHA-256 encryption before being sent. Use Google Tag Diagnostics to check the hashing process and verify the first-party data match rate.
For Meta's Conversions API (CAPI), inspect the server-side payload to confirm event_id parity between browser and server events - this prevents double-counting. Also, check that the fbc and fbp parameters are included to improve attribution accuracy.
If you're using server-side Google Tag Manager (sGTM), make sure conversion tags fire through your designated server endpoint rather than the standard client-side route. Use GTM Server Preview to inspect request and response headers. For mobile apps, tools like Charles Proxy or Fiddler can intercept network requests from SDKs like Firebase or Amplitude to confirm events fire with the correct properties.
Finally, compare your model-attributed revenue with a server-side "truth set" from your backend CRM or e-commerce platform, such as Shopify. Your data completeness rate should be at least 95%. Anything lower indicates major tracking gaps.
Audit Data Accuracy and Integrity
Even with a perfect tracking setup, unreliable data can undermine everything. Accurate data is the backbone of dependable attribution, and bad data can be shockingly expensive. U.S. companies lose an average of $12.9 million annually due to data issues, with around 400 incidents per year causing 2,400 hours of downtime. For PPC campaigns, these errors can lead to wasted budgets and poor optimization choices.
Cross-Check Data Across Platforms
Start by comparing conversion totals between your ad platforms and your primary data source - whether that's your CRM, analytics tool, or e-commerce backend. A revenue discrepancy of 20% or more between platforms is a warning sign of tracking issues. For instance, if Google Ads shows $50,000 in attributed revenue but your Shopify backend only reflects $40,000 from paid traffic, you’ve got a problem that needs immediate resolution.
Different platforms often use distinct attribution windows and logic. To fix this, align everything using a unified data layer. For example, in 2023, Booyah Advertising implemented a unified pipeline that achieved near-perfect accuracy. Tyler Corcoran, Marketing Analytics Manager at Booyah Advertising, shared:
"With Improvado, we now trust the data. If anything is wrong, it's how someone on the team is viewing it, not the data itself. It's 99.9% accurate."
Keep in mind that some systems, like Google Analytics, may have reporting delays of up to 48 hours, while others provide near real-time data. Once you’ve confirmed data consistency, the next step is to ensure conversion events aren’t being double-counted.
Eliminate Duplicate or Inflated Conversions
Duplicate conversions can seriously skew your performance metrics. When the same conversion is counted multiple times, your ROAS looks better than it actually is, and your CPA appears lower, which can lead to poor budget allocation.
Start by auditing your conversion actions in Google Ads (Tools & Settings > Measurement > Conversions). Look for redundant actions tracking the same event - like a lead form submission and a CRM import for the same user. For lead generation campaigns, set conversion actions to count "One" instead of "Every" .
Also, check for conflicts between Google Tag Manager and GA4’s "Create Event" tool. If the same event is defined in both systems, it might be logged twice from a single trigger. Similarly, third-party plugins like Shopify’s Google Sales Channel could add tracking scripts that clash with your custom GTM setup.
For e-commerce, use unique transaction IDs with each purchase event. This ensures platforms can identify and ignore duplicate actions - like when a customer refreshes the "thank you" page. Switching to server-side tracking can also help avoid duplicates caused by browser refreshes, ad blockers, or inconsistent page loads.
"If your reporting inflates the number of conversions, your performance strategy is based on fiction. You're not just getting the wrong numbers. You're optimizing toward the wrong outcomes." - Ameet Khabra, PPC Expert
Account for Missing Data
Missing data can be just as damaging as duplicate data. Cross-device activity, cookie restrictions, and users declining tracking consent all create gaps in your attribution. A solid setup should maintain a 7-day attribution health metric above 60%.
To identify tracking gaps, compare the total engagement counts from your ad platforms with the number of usable touches in your attribution dataset. Aim for a Touch Coverage rate of at least 85% for measured engagements. If your numbers fall short, analyze the data by segment - such as device type, browser, landing page, or specific conversion action - to pinpoint where the loss is happening.
Google’s Consent Mode and modeled conversions can help recover data lost due to users rejecting tracking cookies . Enhanced conversions, for instance, can restore 15% to 25% of conversions lost to cookie restrictions, making them a critical tool in today’s privacy-focused environment.
Finally, integrate CRM data through offline conversion imports to directly connect ad spend to revenue. Strive for an Identity Match Rate of 90% or higher to ensure your data is as complete as possible.
Review Model Alignment with Business Goals
Your attribution model should match how your business generates revenue. For example, what works for a B2B software company with a 90-day sales cycle won’t suit an e-commerce store selling impulse-buy items. Using the wrong model can obscure which campaigns are driving revenue, leading to poor budget decisions.
Evaluate Model Types Against Objectives
Your attribution model should align with your sales cycle and overall goals. For quick purchases, like a $25 t-shirt, last-click attribution works well since the final touchpoint often drives the sale. But for high-ticket items or B2B services - where customers spend weeks or months researching - you’ll need a model that captures the value of early touchpoints. In these cases, data-driven attribution (DDA) or position-based models are better fits.
Data-driven attribution (DDA) can boost conversions by 6–8% without increasing costs compared to last-click models. However, it requires at least 300 conversions and 3,000 ad interactions in 30 days to work effectively. If your account doesn’t meet these thresholds, a position-based (U-shaped) model might be a better option. This model gives 40% credit to the first and last touchpoints, with 20% spread across middle interactions.
Your campaign mix also plays a role. For brands relying heavily on search, last-click attribution might be enough. But if you’re investing in display, video, or social ads to build awareness, you’ll need a model that credits those top-of-funnel efforts appropriately.
| Business Goal | Recommended Attribution Model |
|---|---|
| New Customer Acquisition | First-Click or Position-Based |
| Maximizing ROI/ROAS | Data-Driven or Time Decay |
| Brand Building | First-Click or Linear |
| Short Sales Cycle (Impulse) | Last-Click |
| Complex B2B Sales | Data-Driven or Position-Based |
Once you’ve chosen a model, compare its performance across key metrics to refine your approach.
Compare Model Performance Across Metrics
After selecting a model, evaluate its performance using consistent metrics to get a clearer picture of your campaigns. Tools like the top PPC advertising tools or the Model Comparison feature in Google Ads (Tools & Settings > Measurement > Attribution) or GA4 can help you see how different models distribute credit across campaigns. Use a consistent lookback window - 30, 60, or 90 days - and analyze metrics like conversions, cost per acquisition (CPA), and return on ad spend (ROAS).
Pay attention to percentage changes in conversions when switching models. For example, moving from last-click to first-click attribution in one test caused a 62% drop in brand conversion volume but a 45% increase in non-brand volume. This revealed that non-brand campaigns were assisting brand conversions, even though last-click attribution gave full credit to brand campaigns.
Check the Assisted/Last-click ratio for each campaign. A high ratio indicates that a campaign is helping other channels convert, even if it doesn’t get the final click. Cutting budgets for these "assister" campaigns based only on last-click data can hurt your overall ROI. Segment your analysis by campaign type (brand vs. non-brand), network, device, and ad group to see where credit shifts most significantly.
Run parallel reports for 30–90 days before fully switching models. This helps you establish new performance baselines and adjust bidding targets. For example, when transitioning to DDA, you might need to lower ROAS targets for brand campaigns and raise them for prospecting campaigns, as credit shifts away from bottom-of-funnel activities.
Align Attribution with Campaign Types
Once you’ve evaluated models against your business goals, tailor attribution to match the role of each campaign type in your funnel. Different campaigns serve different purposes, and your attribution model should reflect that. Top-of-funnel campaigns (like display, video, or discovery ads) are designed to build awareness. These work best with first-click or position-based models that capture the start of the customer journey.
Middle-of-funnel campaigns (such as remarketing or content promotion) benefit from linear or data-driven models that spread credit across multiple interactions. Meanwhile, bottom-of-funnel campaigns (like branded search or shopping ads) focus on capturing intent and align well with last-click or data-driven models.
For e-commerce businesses, time-decay models are often preferred since purchase intent grows as customers approach the buying stage. On the other hand, B2B services often work better with position-based models, which balance the value of early discovery with the final decision-making touchpoint.
Adjust your conversion windows based on how long it typically takes customers to make a purchase. Use the Time Lag report in Google Ads to determine the average time from first interaction to conversion. For example, impulse purchases might only need a 1–7 day window, while high-ticket items or B2B sales might require 30–90 days to capture the full journey.
| Business Type | Recommended Click Window | Reasoning |
|---|---|---|
| Impulse Purchases | 1–7 Days | Short decision cycle |
| General Ecommerce | 7–30 Days | Time for research and comparison |
| High-Ticket Items | 30–60 Days | Longer consideration phase |
| B2B / Complex Sales | 30–90 Days | Multi-step buying process |
Conduct Incrementality and Holdout Testing
After ensuring your tracking and data systems are solid, the next step is to confirm your campaign's true impact through incrementality testing.
Attribution models can tell you which touchpoints customers interacted with before converting. But they don’t answer the bigger question: did those touchpoints actually cause the conversion? It’s possible that a customer would have made the purchase even without seeing your ad. Incrementality testing helps determine whether your advertising drove results that wouldn’t have happened otherwise.
Run A/B Holdout Tests
Holdout testing divides your audience into two groups: one that sees your ads (test group) and one that doesn’t (control group). This method quantifies the actual lift your campaign generates. Set aside 10%–15% of your audience as the control group. Platforms like Google Ads and Meta can randomly assign users to these groups. Run the test for 2–4 weeks to account for natural variations. If tracking is a challenge, geo-based experiments - where you compare results across different regions - are a good alternative.
The size of your sample is critical. For example, if your baseline conversion rate is 2%, you’ll need roughly 80,000 users per group to detect a 10% lift with statistical confidence. Once the test is complete, calculate incremental ROAS (iROAS) using this formula:
(Incremental Revenue – Ad Spend) / Ad Spend.
Here’s an example: A mid-sized retailer tested its Facebook campaigns with a 20% control group. While the platform reported a 4.5x ROAS, the true iROAS was only 2.2x - indicating that 51% of the conversions would have happened without the ads.
Timing is everything. Avoid running tests during major sales events like Black Friday, as external factors could skew your results. If live testing isn’t feasible, historical data analysis can still provide insights into incremental effects.
Use Historical Data with Machine Learning
When live holdout tests aren’t practical, machine learning can help validate your attribution model using historical data. Synthetic control methods analyze past performance trends to create artificial control groups, simulating a scenario where no campaign was run. A fixed 90-day dataset is ideal for this approach, and tools like Google’s CausalImpact or Microsoft’s EconML can help build these controls while addressing data drift issues.
The process involves running parallel models - one with incrementality data and one without - to see if the test data improves prediction accuracy. For example, in 2025, Procter & Gamble used Causal Machine Learning for attribution validation and saw a 22% improvement in detecting true incremental lift compared to older methods. Similarly, Uber Eats used geo-testing to show an 18% rise in incremental orders from localized ads.
Before relying on machine learning models, ensure your data is reliable. Activate server-side tracking and deduplication tools like Meta’s Conversion API to create a trustworthy "truth set". Use bootstrapping to resample historical user paths and establish confidence intervals for channel credits. If the intervals overlap significantly, avoid reallocating budgets based on those results.
Benchmark Against Industry Standards
Once you've gathered your incrementality results, it’s important to compare them against industry benchmarks to see how your campaigns stack up. For example:
- Brand awareness campaigns usually show a 5% to 15% lift.
- Retargeting campaigns deliver a 10% to 30% lift.
- Prospecting campaigns can achieve a 20% to 100%+ lift.
Aim for a p-value below 0.05 and a 95% confidence level. For geo-based tests, target an R² above 0.7 and a Mean Absolute Percentage Error (MAPE) below 20%. These metrics ensure your model is accurately predicting baseline performance.
Here’s a real-world example: A major CPG brand discovered that its TV ads only drove an 8% incremental lift, despite attribution models claiming 35%. By reallocating $2.3 million annually based on this data, the brand boosted its marketing ROI by 31%. This process is a core component of a broader PPC optimization checklist designed to maximize returns. This underscores how traditional attribution often overestimates channel contributions by 20% to 40% on average.
| Channel Type | Expected Incremental Lift | Recommended Test Method |
|---|---|---|
| Brand Awareness | 5% – 15% | Geo-experiment / Brand Lift Study |
| Paid Social | 5% – 15% | User-level Holdout / Ghost Bidding |
| Retargeting | 10% – 30% | User-level Holdout |
| Prospecting | 20% – 100%+ | Geo-experiment / Audience Split |
| Non-Brand Search | Low to Moderate | Geo-holdout |
| Brand Search | Often < 15% | Geo-holdout / Pause Test |
Reallocating budgets based on incremental lift can improve overall ROAS by 15% to 40%. By 2025, 73% of marketing leaders considered incrementality testing essential - up from just 41% in 2023.
Monitor Long-Term Performance and Adaptation
Attribution validation isn’t a one-and-done process. User behavior, privacy regulations, and platform updates constantly evolve, which means your model’s accuracy can take a hit if you’re not keeping an eye on it. Without consistent monitoring, you could end up basing budget decisions on outdated data.
Building on the technical and analytical steps already discussed, long-term monitoring ensures your model stays accurate and reliable.
Conduct Regular Audits
Set up quarterly audits to verify your model’s accuracy. Compare your current model with alternatives over a 90-day period. For instance, you could test a rule-based model against an algorithmic one, like Shapley value, to see how credit shifts under different assumptions. This "dual-run" strategy can uncover mid-funnel value that simpler models might miss.
Keep an eye on key metrics like Attribution Health (target above 60%) and platform variance (aim for less than 20%). If your channel credit shares swing by more than 10% week-over-week without changes to your strategy or windows, that’s a red flag for tracking or tagging issues that need immediate attention.
It’s also worth revisiting your lookback windows periodically. A 30-day window might have worked six months ago, but your current sales cycle could require adjustments. Run sensitivity tests using 30-, 60-, and 90-day windows to ensure you’re capturing the full customer journey without over-crediting irrelevant touchpoints.
These audits lay the groundwork for refining your post-implementation tracking.
Track Post-Implementation Performance
After implementing model changes, give it some time before diving into the results. Wait until the average number of days it takes for a conversion to occur has passed. Non-last-click models often show a longer lag as credit is distributed across multiple touchpoints, so exclude the most recent 14–30 days of data to avoid skewed analysis.
Leverage comparison columns in Google Ads to track performance changes. Add columns like "Conversions (current model)" and "Cost / conv. (current model)" to directly compare your new model against the old one. Watch for credit redistribution - upper-funnel campaigns like "Generic" often gain credit, while lower-funnel campaigns like "Brand" may lose some.
To measure the true impact of your model, evaluate incremental ROAS at the cohort level. Group users into weekly acquisition cohorts based on their first interaction, then track their value over 30–90 days under the new attribution rules. This approach shows whether reallocating your budget is actually driving higher revenue.
Keep all your findings organized in a centralized tracking log, like a Google Sheet. Document every audit, test, and adjustment to avoid duplicating work and to provide your team with a clear understanding of past decisions. Automate daily reconciliation jobs to ensure data completeness, aiming for a 95% or higher completion rate.
Once your performance metrics stabilize, you can tweak your strategies to align with changes in your PPC campaigns.
Adapt to PPC-Specific Changes
Your attribution model should evolve alongside your PPC efforts. For example, when switching models, recalibrate your bid targets. If you’re using Target CPA or Target ROAS, adjust your targets by the same percentage as the change in cost-per-conversion shown in the "Conversions (current model)" column. This helps avoid over- or under-bidding.
Review search term reports weekly and add negative keywords where needed. Low-intent traffic can skew your attribution model by creating irrelevant touchpoints. Also, make sure your pages load in under 2 seconds - slow load times increase bounce rates and hurt Quality Scores, which feed into your model’s calculations.
Refresh your ad copy every 30–45 days to combat creative fatigue. Even the best attribution model can’t compensate for ads that no longer resonate with your audience. If your creative becomes stale, the touchpoint data feeding your model loses its relevance.
Lastly, double-check that Google Consent Mode v2 shows "modeling active" status. This ensures conversion modeling is recovering data lost when users decline consent.
| Audit Step | Frequency | Key Metric/Action |
|---|---|---|
| Quick Audit | Monthly | Check Attribution Health (>60%) and platform variance (<20%) |
| Stability Check | Weekly | Monitor for <10% variance in channel shares |
| Comprehensive Audit | Quarterly | Reassess lookback windows, bid strategies, and keyword bids |
| Creative Refresh | Every 30–45 Days | Refresh ad copy to maintain relevance |
When properly maintained, multi-touch attribution can deliver real results. Companies report a 14–36% improvement in CPA, while B2B teams see an average ROI lift of 19% within the first year. These benefits only come when attribution is treated as an ongoing process, not a one-time setup.
Conclusion
Validating your attribution model isn't just a routine task - it’s what turns budget decisions from guesswork into precision. Without frequent validation, you risk funneling resources into channels that look successful in last-click reports while neglecting the mid-funnel strategies that actually drive conversions. As privacy regulations tighten and tracking data becomes scarcer, older models lose their reliability, making consistent validation even more essential.
Here’s a compelling stat: 75% of companies report a 14–36% improvement in Cost Per Acquisition after implementing and validating multi-touch attribution. Top PPC agencies helping B2B marketing teams, in particular, see an average 19% ROI lift within the first year. These kinds of results don’t happen by accident - they’re the product of making validation a continuous process.
"Treat attribution accuracy like any other performance metric: define what 'good' looks like, instrument data and processes to hit that standard, and review results in the same rhythm as pipeline and revenue." - Pedowitz Group
This advice underscores the importance of ongoing monitoring. To strengthen your validation efforts, focus on three key areas: technical integrity (ensuring accurate tracking of user interactions), data accuracy (keeping model outputs aligned with CRM and Finance records, with a variance under 5%), and business alignment (linking model decisions to measurable ROAS improvements). Regular dual-model testing, a centralized tracking log, and early involvement from Finance can help establish trust and credibility in your attribution data.
The takeaway? Your attribution model is only as reliable as the validation process supporting it. Misleading data leads to flawed strategies. Make validation part of your routine - weekly technical reviews, monthly performance audits, and quarterly strategic audits - to ensure your budget decisions are backed by accurate, actionable insights that boost ROI.
FAQs
What’s the fastest way to confirm my conversion tracking is firing correctly?
To quickly ensure your conversion tracking is functioning properly, use debugging tools like Google Tag Assistant. Verify that your conversion tags are firing as expected and check your conversion reports to confirm data is being recorded accurately. For a deeper dive, audit your entire tracking setup - this includes reviewing tag implementation and cross-device tracking - to catch and fix any possible problems.
How do I choose the right attribution model for my sales cycle?
To pick the best attribution model, think about how long and intricate your sales cycle is. If your sales process is quick, single-touch models like last-click attribution might do the trick. However, for longer or more complex customer journeys, multi-touch models - such as linear or position-based - are often a better fit.
For even greater precision, custom models can be tailored to your specific customer journey. These models let you assign weights to different touchpoints and cross-check their effectiveness against your revenue data. The key is to match your attribution model to how your customers actually behave for the most reliable insights.
How can I prove my ads are truly incremental, not just claiming credit?
To ensure your ads are driving additional results, consider using incrementality testing methods such as lift studies, geo experiments, and holdout groups. These controlled experiments help you compare test and control groups, making it easier to determine the actual impact of your campaigns. Pay close attention to designing reliable experiments and focus on analyzing incremental ROAS to confirm that your ads are truly contributing to sales beyond what would happen on their own.