If CPC is up, I don’t change bids first. I check traffic quality, tracking, and spend mix. In most PPC accounts, high CPC is a symptom of loose search terms, bad match-type use, weak landing pages, or conversion data you can’t trust.
Here’s the short version: I audit 06/01/2026 to 07/31/2026 first, pull Google Ads, Microsoft Ads, GA4, and CRM data into one view, then check four areas - segments, keywords, tracking, and post-click path. The goal is simple: cut waste, keep high-fit traffic, and improve results within 30 to 60 days.
What I focus on first:
- Spend vs. conversion share by campaign
- Device, geo, and hour-of-day cuts that hide poor CVR or high CPA
- Search terms and match types that leak budget
- Conversion tag errors and missing offline revenue imports
- Landing-page speed and message match after the click
A few numbers shape the review: some accounts leak 30% to 40% of spend into irrelevant queries, broad match can cost 40% to 60% more than exact while converting worse, and mobile pages that take over 3 seconds to load can lose more than half of users. So I audit CPC in context - not as a stand-alone metric, but as part of lead quality, CPA, and revenue.
If I had to sum it up in one line, it’s this: I want lower-cost clicks only when they bring better business results.
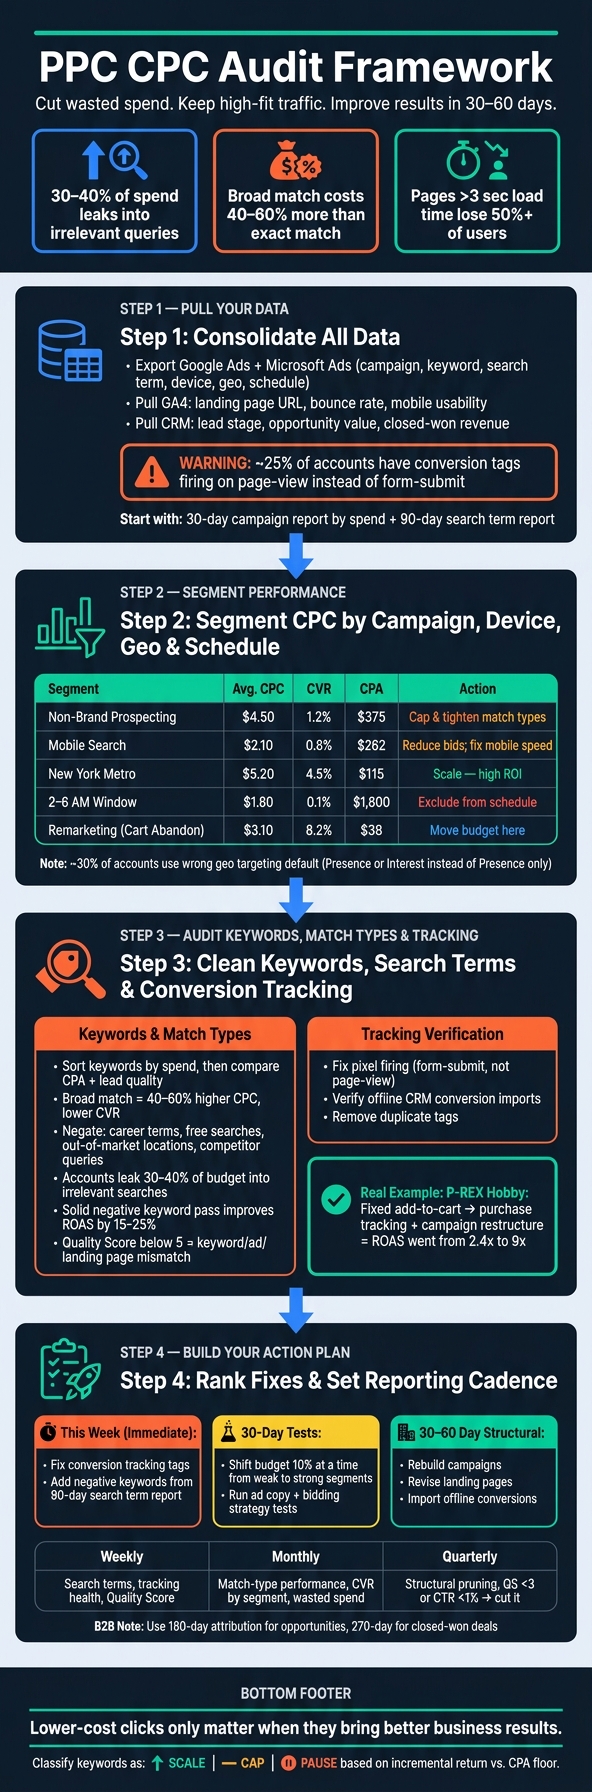
PPC CPC Audit Framework: 4-Step Process to Cut Waste & Improve ROI
How to Audit & Optimize Your Google Ads PPC Campaign in 2026 | Step-by-Step Guide
sbb-itb-89b8f36
1. Pull the data you need before the audit starts
Before the audit starts, gather the data in one sheet. If you rely on platform reports alone, you can end up fixing the wrong thing. The point here is simple: build one working view of spend, intent, and downstream value.
Export platform and funnel metrics into one sheet
Start with Google Ads and Microsoft Ads. Use Supermetrics to export campaign, ad group, keyword, and search term data, plus match type, device, geo, and day/hour schedule. In that same sheet, pull spend, clicks, average CPC, CTR, conversions, conversion value, impression share, and Quality Score. Include Quality Score because it can help flag ad relevance and landing-page issues that push CPC up.
Then bring in GA4 and CRM data next to the ad platform data. That gives you a way to judge CPC against downstream value - not just clicks or leads. From GA4, pull landing page URL, bounce rate, and mobile landing-page usability. From your CRM, pull lead stage, opportunity value, signed-deal events, and revenue.
A lot of lead-gen accounts still miss offline revenue uploads. When that happens, bidding gets tuned to leads instead of revenue outcomes. That can look fine in-platform while sales quality slips. Use CRM and conversion-path data to separate cheap clicks from qualified clicks.
Start with:
- A 30-day campaign report sorted by spend
- A 90-day search-term report
Once the data is in one place, compare it against prior periods and benchmarks before you call anything efficient or inefficient.
Check benchmarks before diagnosing problems
Compare current performance with the prior 30 days and with industry benchmarks before diagnosing problems. This helps you tell whether high CPC is the core issue or just a symptom of weak relevance, bad tracking, or low conversion quality.
One easy miss: make sure conversion tags are firing on the right events before you trust the numbers. Approximately 25% of accounts have at least one conversion action firing on a page-view instead of a form-submit. That kind of misfire corrupts bidding signals and makes every efficiency metric unreliable.
Use this sheet to isolate the worst-performing campaign, device, geo, and schedule segments in the next step. That baseline shows where to cut next: campaign, device, geo, and schedule.
2. Segment CPC performance to find where costs rise and quality drops
Once your baseline data sits in one sheet, the next step is to break it into segments. Averages can make problems look smaller than they are. A campaign may look healthy at the top level but still burn money on one device, one metro area, or one time block. Sort each cut by spend, CVR, and CPA before you decide what's working.
Compare campaign, device, geo, and schedule segments
Start with spend concentration. Pull the top three campaigns by spend, then compare their share of total conversions. If spend share is much higher than conversion share, that's your first place to dig.
Next, cut the data by device. Compare CVR and CPA across desktop, mobile, and tablet. Cheap clicks don't help much if conversion rates trail.
For location, check your targeting settings first. About 30% of accounts get this wrong by leaving the default setting on "Presence or interest" instead of "Presence: People in or regularly in your targeted locations," which can drive out-of-market waste.
For schedule, look for time blocks with weak conversion rates, plus signs of bot or invalid traffic. If a window keeps underperforming, add it to an ad schedule exclusion.
Build a side-by-side performance table
The table below shows what this kind of segment cut looks like in practice. Focus on segments where CPC goes up while lead quality gets worse.
| Segment | Spend | Avg. CPC | CVR | CPA | Lead quality | Action |
|---|---|---|---|---|---|---|
| Campaign: Non-Brand Prospecting | $5,000 | $4.50 | 1.2% | $375 | Low (High MQL-to-SQL drop) | Cap budget; tighten match types |
| Device: Mobile (Search) | $3,200 | $2.10 | 0.8% | $262 | Moderate (High bounce rate) | Reduce bids; check mobile speed |
| Geo: New York Metro | $2,800 | $5.20 | 4.5% | $115 | High (Fast sales cycle) | Scale; incremental ROI is high |
| Time: 2:00 AM - 6:00 AM | $450 | $1.80 | 0.1% | $1,800 | Very Low (Bot/Invalid traffic) | Exclude schedule from bidding |
| Audience: Remarketing (Cart Abandon) | $1,200 | $3.10 | 8.2% | $38 | High (High ROAS) | Move budget from weak campaigns |
Treat this table like a working document, not a one-and-done snapshot. If a segment stays under your CPA floor across back-to-back measurement windows, cap it or pause it. If return on added spend clears your target, scale it. These cuts also tell you where to look next in your keyword, match-type, and search-term review.
3. Audit keywords, match types, and conversion paths
Check keyword performance, search terms, and negatives
Your segment table from the last step should already show where things are going off track. Start with the weakest cuts by campaign, device, geo, and schedule. Then drill down to the keywords behind the spend.
Sort keywords by spend first. After that, compare CPA and lead quality side by side. A keyword can look fine if you only look at CPA, but still bring in low-intent traffic that never turns into closed business. The better test is simple: can the next dollar spent on that keyword beat your CPA floor?
The rule here is plain: spend only where the next dollar can beat your CPA floor.
Broad match is often where waste piles up. Broad match clicks can cost 40% to 60% more than exact match variants while converting at a lower rate. In one audit, MQL cost dropped from about $14,000 to $3,200 after shifting away from broad-match, low-intent terms toward phrase and exact match, while also disabling Search Partners.
Next, pull the search term report and scan for patterns. The usual suspects include:
- Career terms
- Free searches
- Out-of-market locations
- Competitor queries
Accounts often leak 30% to 40% of budget into irrelevant searches. A solid negative keyword pass can improve ROAS by 15% to 25%. Also check Quality Score. Anything below 5 usually points to a mismatch between the keyword, ad copy, and landing page. When that happens, you often pay more and still end up in worse positions.
Use the cleaned-up query list to decide what to negate before you touch bids. Once search terms are clean, move to the next step: make sure the traffic you keep still has a clear path to convert.
Verify tracking and review the post-click path
After cleaning up queries, check tracking and the landing page path before moving budget around. Keyword changes won't help much if your conversion data is off. Before you act on any audit finding, confirm that your main conversion actions are firing the right way, offline conversion imports are syncing with your CRM, and duplicate tags aren't inflating totals.
Here's a good example of how much bad tracking can cost. Hustle Marketers audited P-REX Hobby, a Shopify-based collectibles account running at 2.4x ROAS. The audit found conversion tracking was firing on "add-to-cart" instead of "purchase." After fixing the conversion event and restructuring campaigns by margin tier, ROAS climbed to 9x through Q4.
Once tracking is clean, review the post-click path. Each ad should send people to a landing page that matches the search intent - not just the keyword. That's a big difference. Someone searching with buying intent should not land on a page that feels broad, slow, or half-related.
Mobile speed matters here too. Pages that take more than 3 seconds to load lose more than half of users. That's how expensive clicks turn into dead spend. Use the table below as a quick check before making any bid or budget changes.
| Audit Component | Verification Action | Why It Matters |
|---|---|---|
| Conversion Tracking | Fix pixel firing status; remove duplicate tags | Prevents optimizing around bad data |
| Offline/CRM Sync | Verify offline conversion imports are active and passing revenue data through CRM | Aligns Smart Bidding with actual business outcomes |
| Page Load Speed | Test mobile load time (target: under 3 seconds) | Reduces bounce rate; protects Quality Score |
| Message Match | Match ad headline to landing page headline | Increases conversion rate; lowers effective CPC |
4. Turn audit findings into a clear action plan
Turn your audit into a ranked fix list. Start with the changes most likely to cut wasted spend first.
Rank fixes by savings potential and business impact
Once the audit is done, it’s tempting to fix everything at once. That usually backfires. A simple three-tier plan makes the work easier to manage and helps protect platform learning periods. It also makes priorities clear: what you fix now, what you test next, and what you rebuild later.
Immediate fixes (this week): Start with tracking. Tracking errors are common, so fix conversion events first. Then review the Search Terms report for the last 90 days and add negative keywords for irrelevant intent.
30-day tests: Move budget in small steps - about 10% at a time - from weaker segments to stronger ones. Run ad copy tests and bidding strategy tests during the same window.
Structural changes (30-60 days out): Save campaign rebuilds, landing page revisions, and offline conversion imports for a 30- to 60-day plan. Platforms need time to relearn, and big account changes can muddy the picture if you rush them.
Classify each keyword as Scale, Cap, or Pause based on expected incremental return versus your CPA floor.
Set a reporting cadence and success criteria
After you make changes, let the account run for two to four weeks before changing anything else. Try to get at least 30 conversions before touching bids or keywords again.
From there, stick to a fixed review schedule so you don’t overcorrect. The point of the cadence below is simple: check whether CPC is buying better traffic, not just cheaper clicks.
| Cadence | What to Review | Action Trigger |
|---|---|---|
| Weekly | Search terms, tracking health, Quality Score direction | New negatives needed; tracking issues |
| Monthly | Match-type performance, CVR by segment, wasted spend | ROAS vs. target; audience shifts |
| Quarterly | Structural pruning, experiment results | QS under 3 or CTR under 1% - cut it |
If you’re on a B2B team with a longer sales cycle, connect your ad platforms straight to CRM data and use attribution windows of at least 180 days for opportunities and 270 days for closed-won deals. If you only optimize for top-of-funnel leads, you won’t know whether CPC spend is moving pipeline.
Track avg. CPC, CVR, CPA, and qualified lead rate by segment - not just at the account level. Account averages can hide where performance is slipping.
FAQs
What should I check before lowering bids?
Before you lower bids, make sure the drop in performance isn’t coming from somewhere else.
Start with marginal ROI. If your incremental CPA is above your profitability floor, a bid cut can make sense. But if performance stays weak, pausing the campaign or capping spend may be the better move.
Then check the basics that often get missed:
- Saturation signals
- Landing page relevance
- Message match
- Conversion friction
Use consistent 30-90 day data when you review performance. Don’t react to a single bad day or a short-term spike.
How much data do I need for a CPC audit?
Review at least 30 to 90 days of performance data so you can spot patterns that hold up over time. If the business is seasonal, use a longer window.
For segment decisions, make sure you have enough volume before you change bids. A good rule of thumb is about 1,000 impressions before bid changes, and 200 conversions per device segment over 30 days for device-level adjustments.
Also, double-check that conversion tracking is accurate before you act on smaller datasets.
Which segments usually hide wasted PPC spend?
Wasted PPC spend often gets buried in account-level averages. To find it, dig into the segments that usually hide weak performance: broad match keywords, search terms, audience layers, devices, geographies, placements, and keyword intent.
It also helps to watch for match-type drift and saturation. That’s when traffic gets looser, costs keep climbing, and results move past your target CPA.
The fix is simple in theory, but it takes discipline: optimize by segment. Otherwise, your best performers end up covering for the weak ones, and the account can look fine on the surface while budget slips away underneath.