If I judge a bid algorithm by CPA or ROAS alone, I can miss the real problem. A test can look fine on the surface while volume drops, margin shrinks, or conversions just haven’t shown up yet.
Here’s the short version, based on top PPC tools and strategies:
- CPA shows cost efficiency, but it can reward cheap, low-value conversions.
- ROAS shows revenue efficiency, but not profit.
- Win rate shows whether bids are still entering enough auctions.
- Margin shows whether sales still make money after costs.
- Spend variance shows whether pacing is stable enough to trust the test.
- Conversion delay shows whether I’m judging the test too early.
- Impression quality shows whether the algorithm is getting into the right auctions.
A few numbers from the article make the point fast:
- I should wait for at least 2 full conversion cycles
- I usually want at least 50 conversions before reading direction
- For tighter test reads, I should aim for 100 conversions per test arm
- Daily spend variance above roughly 10%–15% in stable accounts can be a warning
- Many tests need 7–14 days before early auction signals settle
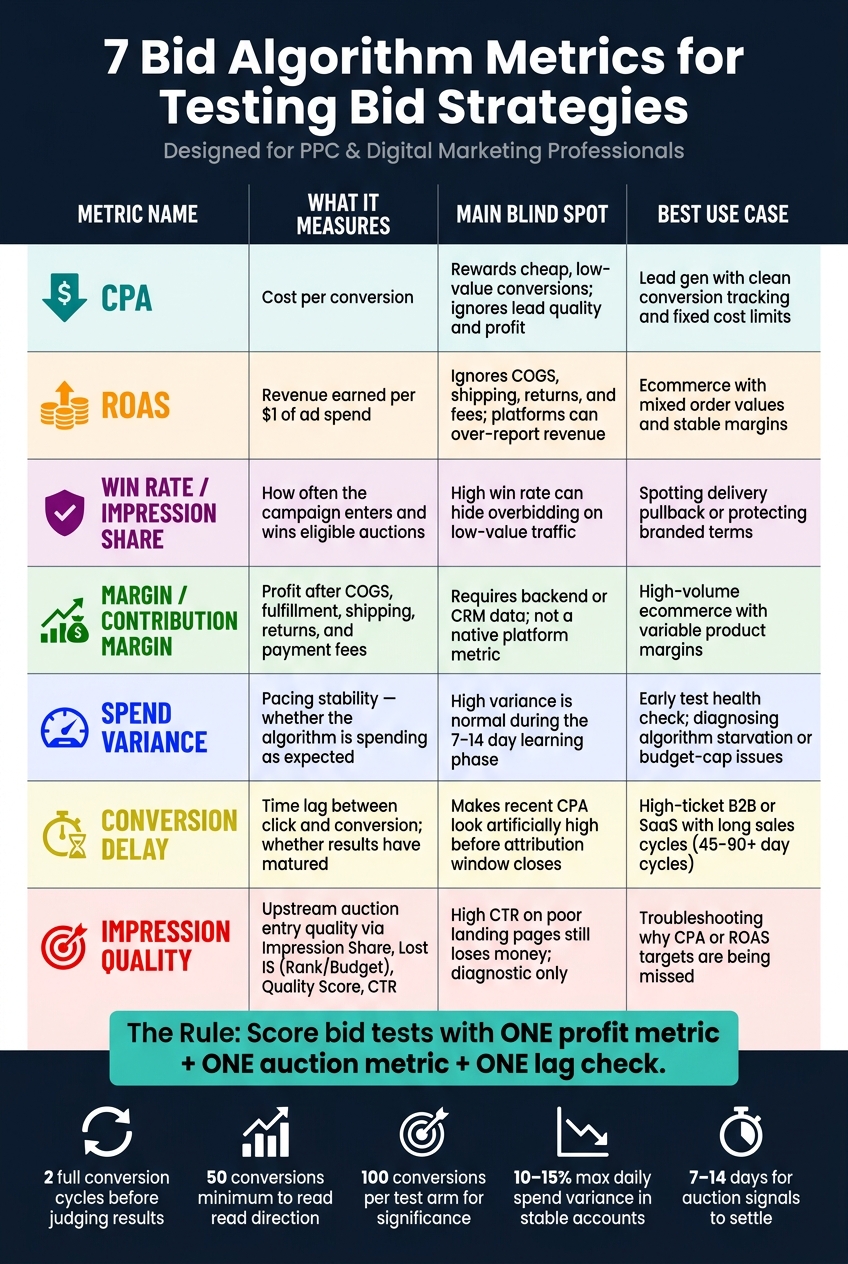
7 Bid Algorithm Metrics: What They Measure, Blind Spots & Best Use
Smart Bidding Performance Fluctuations | Google Ads
sbb-itb-89b8f36
Quick Comparison
| Metric | What it tells me | Main blind spot | Best use |
|---|---|---|---|
| CPA | Cost per conversion | Ignores lead quality and profit | Lead gen with clean conversion tracking |
| ROAS | Revenue per $1 spent | Ignores COGS, shipping, returns, and fees | Ecommerce with mixed order values |
| Win rate | Auction presence | Doesn’t show business outcome | Spotting delivery pullback |
| Margin | Profit after costs | Needs backend data | Product mix and profit checks |
| Spend variance | Pacing stability | Can swing during learning | Early test health check |
| Conversion delay | Time lag before results mature | Easy to ignore in short tests | Avoiding false negatives |
| Impression quality | Auction and traffic entry quality | Upstream only; not a profit metric | Early signal on rank, budget, or relevance issues |
If I had to boil the article down to one rule, it’s this: score bid tests with one profit metric, one auction metric, and one lag check. That gives me a much cleaner read than staring at a single dashboard number and guessing.
The rest of the article explains how each metric helps me spot a different kind of weak bid behavior.
1. CPA
CPA is only useful when the conversion you track has real business value.
Business Outcome Fit
A low CPA sounds good on paper. But for weak algorithms, it only matters if those conversions are worth paying for.
That’s where CPA can trip people up. It can reward spam, weak leads, or actions that don’t turn into revenue. In plain English: the system can make CPA look better by going after the cheapest conversions, even if those conversions don’t help the business.
CPA works best when the conversion lines up with revenue, LTV, or approved margin. If that link is weak, CPA can point you in the wrong direction.
Diagnostic Value
CPA tells you about efficiency. It does not tell you why performance changed.
So don’t look at CPA by itself. Put it next to CTR, conversion rate, and the bid strategy report. That gives you a clearer read on what’s going on.
For example, a high CTR with a low conversion rate usually points to traffic quality, not the bid algorithm. In that case, the issue is often who you’re bringing in, not how the system is bidding.
Use CPA to spot drift. Then check whether the algorithm traded quality for lower costs. If CPA moves and there’s no clear traffic or tracking change, ROAS and margin will often explain the shift.
Test Timing Sensitivity
CPA is very sensitive to conversion delay and short test windows.
Reliable inference usually needs at least two full conversion cycles or a minimum of 50 conversions. If you want stricter significance testing, aim for at least 100 conversions per test arm.
Here’s the catch: if a lot of conversions come in 14+ days after the click, recent CPA can look worse than it actually is. That’s not a small detail. It can make a test look like a loser when it just hasn’t had time to mature.
Check the days-to-conversion report and add a lag buffer before making a final call.
Optimization Actionability
CPA is one of the easier levers to act on.
- Lower tCPA to improve efficiency and cut volume
- Raise tCPA to bid more aggressively and win back impression share
- Use the Bid Simulator before changing targets
There’s also a practical floor here. Below 30 conversions per month, Smart Bidding usually doesn’t have enough data, and manual bidding often does better.
If CPA improves only because volume drops, the next place to look is ROAS.
2. ROAS
ROAS measures how much revenue you get for every $1 spent on ads. It’s often a better match for e-commerce, especially when order values swing a lot from one purchase to the next. CPA gives every conversion the same weight. ROAS doesn’t. It adds revenue into the picture, which makes it more useful for accounts with mixed order values.
Business Outcome Fit
ROAS tracks revenue, not profit. That difference matters more than it may seem.
"ROAS is a revenue metric, not a profit metric. If your client sells a $100 product with $20 of margin and ships it for free, a 4:1 ROAS isn't profitable. It's a slow leak." - Jacques Venter, Swydo
A 4:1 ROAS can still mean break-even if margin is 20%. So yes, the algorithm can hit the ROAS target and still leave the business losing money on every order. That’s the catch. ROAS can confirm revenue efficiency while hiding bad bidding from a profit standpoint.
That’s why ROAS targets shouldn’t be picked out of thin air. They need to come from actual unit economics. If margin changes a lot across the catalog, margin is the better metric to watch.
Diagnostic Value
If ROAS is the right target, the next step is figuring out why it moved. Did bidding slip? Did budget get tighter? Did traffic mix change?
ROAS can move for reasons that have nothing to do with bidding alone. A mix shift, promo traffic, or branded demand can all change the number. If ROAS drops, check:
- Search Lost IS (Rank)
- Search Lost IS (Budget)
- Landing page conversion rate
That helps separate bidding issues from budget or traffic issues. For example, if ROAS drops and Lost IS (Rank) is high, the problem usually points to ad relevance or bids, not the algorithm itself. That split matters because it tells you whether the model is bidding badly or just working with weaker traffic.
Also, don’t stop at aggregate ROAS. It can look fine while new customer acquisition quietly slides. Break out ROAS for new vs. returning customers before making the call.
Test Timing Sensitivity
ROAS usually takes longer to read than CPA because revenue needs time to show up. Spend happens right away. Revenue often doesn’t.
That delay can make recent ROAS look worse than final ROAS. And that’s where teams get into trouble. They shut off a test too early and make a decent strategy look bad.
"The bidding algorithm may adapt quickly, but the business's actual revenue signals often take longer to surface. That delay in data creates a volatility window where early performance data can look worse or better than it truly is." - Sarah Stemen, Owner, Sarah Stemen, LLC
Wait for at least two to three full conversion cycles before judging the results. Use Conversion Value (By Time) in the Report Editor so revenue is tied to the day the conversion happened, not the click date. That gives you a cleaner read on the test.
Optimization Actionability
Target ROAS lets you trade volume for efficiency. Lower the target if you want more volume. Raise it if you want tighter spend. The system adjusts bids based on value goals, not conversion goals.
There’s also a common trap here. Some teams set Target ROAS equal to break-even MER. On paper, that sounds fine. In practice, it can go sideways because platforms may over-credit revenue by 30% to 60% versus actual revenue. So if the target is built from platform numbers alone, you can still end up underwater.
If ROAS improves while win rate or impression quality drops, take that as a warning sign. It often means the algorithm is backing into branded or retargeting traffic. Those are the easy wins. They can make the number look better without adding much net growth.
If ROAS goes up but profit keeps slipping, margin is the next place to look.
3. Win Rate
Win rate - most often tracked as Impression Share - shows how often your campaign entered and won eligible auctions. Unlike CPA or ROAS, it doesn’t tell you what happened after the click. It tells you whether your algorithm showed up in the first place.
If ROAS still looks fine but volume starts to slide, win rate helps you see whether the algorithm is still in the game.
Business Outcome Fit
Win rate is a health metric, not a business outcome metric. It shows auction presence, not revenue or profit. That gap matters.
A high win rate can hide weak results farther down the funnel. An algorithm might win a lot of auctions by going after users who submit forms but never become customers. On paper, CPA can stay low while actual cost per qualified lead gets worse.
On brand terms, a high win rate can also mean you’re picking up traffic you likely would have gotten anyway, not driving much extra value.
Diagnostic Value
Win rate is most useful when you’re trying to figure out why results are soft. It breaks the issue into two clear buckets: Search Lost IS (Budget) and Search Lost IS (Rank).
- High Lost IS (Budget) means budget is the limit.
- High Lost IS (Rank) points to bids, Quality Score, or landing page relevance.
When tROAS targets are set too high compared with past performance, the algorithm often pulls back from most auctions. Impression share drops hard, but CPA and ROAS on the small set of auctions it still wins can look fine. That can hide the actual issue.
Because it updates early, win rate is one of the first things to check in a test.
Test Timing Sensitivity
Win rate changes soon after a bid adjustment, which makes it one of the earliest test signals. That speed helps a lot in the first 7–14 days, when you need to confirm that the algorithm is bidding instead of freezing because the targets are too aggressive.
Still, a dip in win rate during a test doesn’t always mean trouble. Smart Bidding can ignore low-odds auctions and put more spend into clicks with better expected value. So if win rate falls but ROAS stays steady or improves, the algorithm may be doing exactly what it should.
Outside pressure matters too. If a competitor starts a conquesting campaign, your win rate can drop overnight even if nothing changed in your account. Before you react, check Auction Insights or use automated bid management tools.
Use early win rate movement to see whether the algorithm is pushing forward or backing away.
Optimization Actionability
Use win rate as a guardrail, not a goal. Chasing 100% impression share on non-brand terms usually isn’t worth the spend.
"Chasing 100% on non-brand is usually an expensive ego exercise." - Eric Huebner, North Country Growth
The last 10–20% of auctions often costs far more than it’s worth because CPC tends to climb enough to wreck profit. For competitive non-brand terms, a healthy range is usually around 60–70% impression share. Branded campaigns should stay above 90%.
When win rate drops and volume falls with it, slowly lower the Target ROAS or lift the Target CPA so the algorithm has more room to compete. If win rate is high but profit starts slipping, check margin next.
4. Margin
Business Outcome Fit
CPA and ROAS can look fine on the surface while profit quietly slips. That’s where margin comes in, often managed by top PPC agencies to ensure profitability. It’s the metric that shows whether the business is still making money after fulfillment, shipping, returns, and payment fees.
"A 6x ROAS on a 15% margin product loses money once returns, shipping, and acquisition costs are layered in." - Wameq
So if the algorithm is driving a 6x ROAS on discount-heavy orders with high return rates, the dashboard may look healthy while the P&L says something else. Contribution margin - revenue minus COGS, fulfillment, shipping, returns, and payment processing - is the one number that tells you whether the bid strategy is helping the business or just driving top-line sales.
Diagnostic Value
Margin helps you see if the algorithm is pushing the right products instead of simply chasing the most revenue.
If margin falls while CPA and ROAS stay steady, that usually points to the same issue: the algorithm is leaning into high-volume, low-margin products. And that can be a bad trade. A product with a lower AOV but a better margin can beat a high-AOV product on profit, even if ROAS makes the second one look stronger.
"The algorithm has no inherent awareness of what it costs you to fulfill that revenue... your account will look healthy. Your P&L won't." - Macetric
Test Timing Sensitivity
Margin takes longer to settle than CPA or ROAS. Returns and revenue recognition slow everything down, especially for higher-ticket B2C or B2B purchases. In those cases, the gap between a click and a completed, non-returned sale can stretch from 60 to 90 days.
That’s why Conversion Value (by Time) in the Google Ads Report Editor gives a better read than default click-date attribution. It helps you judge which cohorts are actually profitable, not just which ones looked good at the time of the click.
Optimization Actionability
Once margin shows you what’s off, the next step is to change the value signal going into bidding. Instead of passing order total as conversion value, pass contribution margin. That shifts Smart Bidding toward profit, not just revenue.
If you can’t do that yet, Conversion Value Rules in Google Ads can still help. You can adjust values by audience or product segment. For example:
- Apply a 1.5x multiplier to high-margin SKUs
- Apply a 0.5x multiplier to low-margin SKUs
You can also split campaigns by margin tier and set margin-based tROAS to about 35% of the old tROAS when average margin is 35%. That gives the bid system a target that lines up better with what the business keeps, not just what it sells.
5. Spend Variance
If win rate tells you whether the algorithm is winning auctions, spend variance tells you whether it’s spending in a steady enough way for the test to mean anything.
Business Outcome Fit
Spend variance shows whether the algorithm is spending the way you expected. Sharp spikes often mean it’s chasing weak inventory. You can identify these low-quality placements using PPC competitive analysis tools. Sharp drops usually mean your target is too tight.
"When you set a Target ROAS of 800% but your historical average is 350%, the algorithm does not try harder. It retreats." - Alexander Perelman, Head of Product, groas
Diagnostic Value
In A/B bid tests, spend variance is often the first clear sign that one variant has stopped pacing under the same conditions as the other. And once pacing becomes uneven, the comparison starts to break down.
That matters because the two test arms need to stay independent for the test to hold up.
Test Timing Sensitivity
Use spend variance as your daily early signal. Then look at CPA and ROAS only after 4–6 weeks and 100+ conversions per variant.
Optimization Actionability
For stable accounts, try to keep daily spend variance under 10–15%. During flash sales, a range of 20–25% is usually more realistic. If spend moves past those ranges, check the Bid Strategy Report and Search Lost IS (Budget).
When you launch a new algorithm, start with a target that’s 10–20% looser than past performance. That gives the system some room to explore instead of backing off too soon.
Also, avoid making constant target or budget tweaks. Batch those changes no more than once every two weeks, or you risk repeated learning-phase resets.
"Fast changes destroy the data you need to judge the test." - Eric Huebner, North Country Growth
Once spend settles down, conversion delay helps show whether the results are actual results - or just late ones.
6. Conversion Delay
When spend stays flat but results seem slow, conversion delay helps you tell the difference between actual weak performance and performance that just hasn’t shown up yet.
Business Outcome Fit
Conversion delay changes a lot based on the business model.
Many DTC purchases happen within 24 hours. SaaS and lead-gen are a different story. Those cycles can stretch for weeks or even months. A good rule of thumb:
- Use at least 21 days for e-commerce
- Use 45–60 days for SaaS trials
- Use 90+ days for B2B lead gen
That way, you’re judging results on a window that matches how people buy.
Diagnostic Value
Conversion delay tells you when CPA, ROAS, and margin are actually ready to be judged.
If your conversion window is shorter than the real delay, the algorithm is working from incomplete data. In plain English, it’s making decisions while part of the performance is still missing.
A 60-day SaaS cycle is a good example. It can make tCPA look worse in Google Ads, even while CRM close rates improve later. That’s why CPA, ROAS, and margin should only be judged after the lag window closes.
Test Timing Sensitivity
Early numbers can bounce around because conversions haven’t fully come in yet. That makes early readouts shaky.
High-volume accounts may settle in 5–7 days. Low-volume accounts often need 3+ weeks.
Use "Conversion Value (By Time)" in Report Editor. Standard UI metrics attach revenue to the click date, which can blur what’s happening. Before you score the bid algorithm, wait for the mature conversion window.
Optimization Actionability
After 14 days, adjust targets in 10–15% steps. Bigger moves can throw the system back into learning.
Budget changes of 30% or more can reset learning.
For long-cycle accounts, CRM should be the final source of truth. In B2B, success should be tied to qualified pipeline or closed deals, then checked in CRM.
7. Impression Quality
After lag, the next place to look is upstream. Impression quality tells you whether the algorithm is even getting into the right auctions in the first place. In plain English: before you worry about clicks or conversions, check if the system is showing up where it should.
This group of signals helps you see that. Track Impression Share, Search Lost IS (Rank), Search Lost IS (Budget), Quality Score, and CTR together.
Business Outcome Fit
Impression quality metrics are upstream health checks. They show what happens before the click, which makes them useful when CPA and ROAS don't fully explain what's going wrong.
For brand terms, falling impression share is often a revenue warning. For non-brand terms, though, more share only matters if it still supports profit. More visibility isn't always better if the traffic doesn't pay off.
Quality Score affects CPC too. High QS tends to lower costs, while low QS pushes them up.
Diagnostic Value
This is where impression quality becomes useful in algorithm testing. It helps separate visibility problems from engagement problems. That distinction matters. If performance slips, you need to know whether the campaign isn't entering enough auctions, or whether it's entering them and failing to earn clicks.
Use these signals to narrow down whether the issue is budget, rank, or relevance.
| Diagnostic Signal | Likely Problem | Fix |
|---|---|---|
| High Lost IS (Budget) | Pacing or funding gap | Increase budget or tighten targeting |
| High Lost IS (Rank) | Bid or QS issue | Improve ad relevance, QS, or bidding logic |
| Low CTR | Relevance problem | Rewrite ad copy or refine match types |
A sharp CTR drop is often a leading indicator - it can show up before conversion rate problems do. When impression quality drops first, CPA and ROAS often slide later. That's why CTR is one of the few early warning signs that can expose a weak algorithm while you're still inside the test window.
Test Timing Sensitivity
Impression quality signals move fast. That's helpful, but it also makes them easy to misread.
During the 7–14 day learning phase, IS and CTR can swing hard as the algorithm adjusts, so early readings aren't reliable. A single daily IS snapshot can be noisy. Treat IS and CTR as directional signals early on, not final proof.
Optimization Actionability
The split between Lost IS (Budget) and Lost IS (Rank) makes this set of metrics especially useful for action.
If a campaign is profitable and losing IS because of budget, adding spend can help you pick up revenue you're already in a position to win using paid media optimization platforms. If it's losing IS because of rank, the answer is different. In that case, the fix is better ad relevance, stronger Quality Score, or Google Ads automation tools - not just spending more.
It also helps to track CTR by match type. If CTR starts to fall there, that's often a sign the algorithm is drifting into irrelevant queries.
How These Metrics Perform in PPC Test Scenarios
Different metrics help with different failure modes: profit, auction pressure, and delayed data. That turns testing into three simple checks: did the campaign make money, did it stay competitive, and did the data show up in time?
Profitability and Efficiency: CPA vs. ROAS vs. Margin
CPA tracks cost, ROAS tracks revenue efficiency, and margin tracks profit. In a live test, each one can reveal a different kind of problem.
CPA is a good fit for lead-gen accounts with steady conversion values. But there’s a catch: it can make costs look worse than they are when conversions are still stuck inside the lag window. ROAS fits ecommerce accounts with mixed order values, though platform-reported numbers can give too much credit to campaign performance. Margin is the cleanest profit metric because it pulls in fulfillment, shipping, returns, and fees.
| Metric | Best For | Key Weakness in Short Tests |
|---|---|---|
| CPA | Lead-gen with stable conversion values | Overstates cost when conversions are delayed |
| ROAS | Ecommerce with varying order values | Platform reporting can over-credit revenue |
| Margin | True profitability across any account type | Requires backend or CRM data integration |
Auction Mechanics: Win Rate vs. Spend Variance
Once profit is clear, the next step is to optimize your PPC campaigns by seeing whether the algorithm is winning the auctions it needs to win.
Win rate shows how well you compete in auctions. Spend variance shows how steady pacing is. In testing, these two are most useful together. On their own, neither one tells you if the campaign was profitable.
| Scenario | Win Rate | Spend Variance | Likely Diagnosis | Recommended Action |
|---|---|---|---|---|
| Overbidding | High | High | Algorithm overbidding to hit spend targets | Tighten CPA/ROAS targets to force efficiency |
| Learning Phase | Volatile | High | System calibrating to new objectives | Wait 7–14 days before making changes |
| Low bids or weak Quality Score | Low | Low | Bids or Quality Scores too low to compete | Improve ad relevance or raise bid targets |
| Spend spikes during high-intent windows | Moderate | High | Spend concentrates in high-intent periods | Check whether spikes correlate with stronger conversion quality |
Lag and Traffic Quality: Conversion Delay vs. Impression Quality
If auction behavior looks normal, the next thing to test is whether delayed conversions or weak traffic quality are warping the readout.
Conversion delay explains many false negatives. Recent CPA can look high simply because the conversions from those clicks haven’t come in yet. Impression quality, measured through Impression Share and Lost IS (Rank), shows whether the algorithm is missing auctions because of rank or budget limits.
"If you compare recent performance with past performance, your recent performance might not look as strong because of conversion delay." - Google Ads Support
| Metric | Role in Testing | How It Can Distort Early Conclusions |
|---|---|---|
| Conversion Delay | Contextualizes missing conversions | Makes recent CPA look artificially high; use a window that matches the sales cycle |
| Impression Quality | Identifies whether lost auctions stem from rank or budget issues | High quality scores can mask low-intent traffic that does not convert |
Score the test only after the lag window closes. Before that point, it’s hard to tell if the algorithm is underperforming or if the test is just too early.
Pros and Cons of Each Metric for Diagnosing Weak Algorithms
The useful question isn’t which metric is best. It’s which kind of failure each one helps you spot.
That matters because every metric has a blind spot. CPA can make weak leads look fine. Win rate can make bad bidding look healthy. Margin is the strongest profit check, but you only get it if your backend data is in shape.
Here’s the fastest way to stack them up side by side.
| Metric | Main Advantage | Main Drawback | Best Use |
|---|---|---|---|
| CPA | Fast to read, weak on lead quality | Misses lead quality; rewards cheap, low-value conversions | Lead-gen accounts with fixed cost limits |
| ROAS | Best for revenue efficiency, not profit | Ignores COGS, returns, and fulfillment; platforms can over-report revenue | Ecommerce with stable margins and high conversion volume |
| Win Rate | Best for spotting delivery constraints | High win rate can hide overbidding on low-value traffic | Troubleshooting delivery issues or protecting branded terms |
| Margin | Best proxy for profit | Not a native platform metric; requires CRM or COGS data integration | High-volume ecommerce with variable product margins |
| Spend Variance | Shows pacing instability before outcome metrics move | High variance is normal during the 7–14 day learning phase | Diagnosing algorithm starvation or budget-cap issues |
| Conversion Delay | Explains why early results mislead | Can make recent performance look artificially weak before the attribution window closes | High-ticket B2B or SaaS with long sales cycles |
| Impression Quality | Best early signal of upstream auction weakness | High CTR on poor landing pages still loses money; diagnostic only | Troubleshooting why CPA or ROAS targets are being missed |
Once you compare them this way, the pattern gets pretty obvious: don’t judge performance from just one number. Use one metric for profitability, one for auction mechanics, and one for data quality before you decide whether the algorithm is doing its job.
Conclusion
No single metric can tell you, on its own, that a bid algorithm is weak. Each metric does a different job. Broadly, they fit into three buckets: outcome, auction access, and data timing.
Start with the metric that fits your business model. For lead gen, that means offline conversion tracking to validate outcomes. For e-commerce, look at ROAS first. And if profit swings by product, use contribution margin.
If your main metric looks off, move to auction mechanics next. Check win rate and Search Lost IS to tell the difference between a bidding issue and a delivery issue. If budget loss is high, the campaign is limited by spend, not by bid quality.
Before you judge performance, factor in conversion delay. Delayed conversions can throw off early reads, so give the campaign a full lag window before making changes. After that, check impression quality to see if relevance or landing page problems are holding back delivery.
That’s the sequence: measure profit first, then auction health, then data freshness.
FAQs
Which metric should I trust first?
First, check your first-party conversion quality and make sure the data holds up. Bid algorithms follow the signals you send them. If those signals are incomplete or wrong, performance can drift toward outcomes you don’t actually want.
When you evaluate results, use CRM data or closed-loop revenue as the baseline. Put more weight on cost per qualified pipeline or cost per closed deal than on campaign-level ROAS or raw conversion counts. And give the data enough time to mature by accounting for conversion delays across at least two full conversion cycles.
How long should I wait before judging a bid test?
Wait for at least 30 days of uninterrupted data. That window should include a 14-day ramp-up so the algorithm has time to settle.
You also need to factor in conversion lag. In plain English, that means leaving out the most recent days until at least 90% of conversions have come in. If reporting is slow, stretch the review period to 4–6 weeks.
And don’t rush the read. If volume is low, early results can send you in the wrong direction. A good benchmark is around 50 conversions before making the call.
Why can CPA or ROAS look good while profit falls?
CPA and ROAS can look good even when profit is slipping. The problem is simple: they don't show the whole business picture.
ROAS compares revenue to ad spend. That's useful, but it stops there. It doesn't tell you whether that revenue turned into profit. If your margins are thin, costs like returns, free shipping, and chargebacks can wipe out those gains fast.
CPA has a similar blind spot. It tracks what you pay to get a lead or customer, but it says nothing about lead quality or customer lifetime value. So an algorithm might hit your CPA goal by bringing in low-value leads. Or it may choke off traffic to keep costs down, which can hurt total conversions and slow long-term growth.