Most advertisers lose money on PPC campaigns by relying on guesswork. A structured testing approach can reduce wasted ad spend by nearly 40% and boost ROAS by 20-35%. The key? Testing like a scientist and using clear frameworks to guide your budget decisions.
Here’s a quick breakdown of five effective PPC budget testing frameworks:
- Historical Data Analysis: Use past performance to identify trends and allocate budgets more effectively. Track metrics like ROAS, CPA, and seasonal patterns.
- Performance-Based Reallocation: Dynamically shift budgets from underperforming campaigns to high-performing ones using real-time data.
- Funnel-Stage Budget Segmentation: Divide your budget across the sales funnel - awareness, consideration, and decision - to target users based on intent.
- A/B Testing: Run controlled experiments to validate changes in ads, landing pages, or bidding strategies.
- Gradual Scaling with Real-Time Monitoring: Increase budgets incrementally (10-20%) to avoid performance dips and maintain stability.
These frameworks help you focus your budget where it works best, ensure data-driven decisions, and avoid costly mistakes. Let’s dive into each one.
How Pros Pace PPC Budgets (Steal This Free Template!)
1. Historical Data Analysis and Trend Identification
Instead of relying on guesswork, let past campaign performance guide your budget decisions. Historical data provides a roadmap for smarter allocation strategies.
Start by filtering your ad group reports by impressions or clicks to identify high-performing and low-performing campaigns. Use labels to mark when tests began and track how they impact the conversion funnel. This groundwork helps set the stage for more precise budget tests in future strategies.
Spotting trends in your data can uncover key opportunities for improvement. Pay attention to day-of-week, day-of-month, and seasonal patterns. For instance, if your data shows a spike in conversions every Tuesday morning or a drop during the first week of each month, you can adjust your bids accordingly. One example comes from a Marin Software client in the media industry: they analyzed daily gaps between organic traffic and their goals, then shifted paid budgets to the most efficient publishers. This allowed them to stay within their total budget while maximizing results.
Key Metrics to Track
Keep an eye on Return on Ad Spend (ROAS), Cost Per Acquisition (CPA), and Conversion Rate, as these metrics offer valuable insights into how efficiently your campaigns generate revenue. Additionally, track Impression Share to ensure your budget isn’t too low to capture demand. Monitoring Quality Score components - like ad relevance, expected click-through rate (CTR), and landing page experience - can also help reduce your Cost Per Click by improving ad performance.
Here’s a simple formula to calculate your baseline budget:
Budget = (Target Revenue ÷ Historical ROAS) × 1.2.
The 1.2 multiplier adds a 20% buffer for testing new strategies. For example, if your historical ROAS is 4:1 and your revenue goal is $100,000, you’d need ($100,000 ÷ 4) × 1.2 = $30,000 in budget.
Implementation Complexity
Basic trend identification and filtering can be done with standard reporting tools and doesn’t require advanced skills. However, more sophisticated techniques, like Media Mix Modeling (MMM), which uses non-linear regression to refine cross-channel budget allocation, may require data science expertise. Start with simpler methods, such as dayparting. If your B2B campaigns perform best between 8 AM and 2 PM, increasing bids by 25% during those hours could boost ROAS by over 30%.
Budget Allocation Impact
Using historical data helps you avoid two costly mistakes: overspending on underperforming channels and underfunding campaigns that consistently deliver results. A good rule of thumb is the 70-20-10 rule: allocate 70% of your budget to proven campaigns, 20% to new audiences, and 10% to experimental tests. Before making budget decisions based on trends, aim for at least a 90% confidence level to ensure your results aren’t due to random chance. Limit your analysis to three months or until you’ve collected data that’s 10 times the minimum sample size required.
Once you’ve mapped historical trends, the next step is reallocating budgets based on emerging performance metrics in your ongoing strategy.
2. Performance-Based Budget Reallocation
Once you've spotted performance trends in your campaigns, the next step is to make budget adjustments that align with those trends. This means reallocating funds from campaigns that aren't delivering results to those that are driving stronger returns. Instead of sticking to rigid monthly budgets, this approach lets you manage your PPC spend dynamically, based on real-time performance data.
The key idea here is opportunity analysis - figuring out where your next dollar will make the biggest impact in an auction. For instance, if Campaign A has already tapped into its high-intent audience and is now costing more per click while delivering fewer conversions, it makes sense to shift funds to Campaign B, where the spend-to-conversion ratio is still improving. By acting on these insights, you can fine-tune your budget allocation in real time. Automated tools can help by quickly moving funds from campaigns that are underperforming to those with higher returns, like redirecting money from saturated search campaigns to high-ROAS display ads.
"ROAS metrics that better reflect performance lead to superior results because automated tools, based on machine learning, have more accurate input data."
- Simonas Lisiukas, Director, Customer Intelligence Engineering, Marin Software
Key Metrics to Watch
To pinpoint where budget adjustments are needed, keep an eye on these metrics:
- ROAS (Return on Ad Spend): Helps identify campaigns delivering strong returns.
- CPA (Cost Per Acquisition) and Conversion Rate: Show the cost-effectiveness of campaigns.
- Impression Share: Campaigns with an Impression Share of 85% or higher may have already maxed out their reach.
- Conversion Volume: Indicates overall campaign success.
- Quality Score Components: High costs due to poor ad relevance or other factors might signal issues that extra spending won't solve.
- AOV (Average Order Value), Profit Margin, and CLV (Customer Lifetime Value): Ensure reallocations are driven by profitability, not just surface-level performance.
Managing Changes
Adjusting budgets can range from simple manual updates to advanced automation. If you're starting out, try making small changes - like reallocating 10–20% of your budget weekly. This avoids disrupting Google's Smart Bidding "Learning Mode", which can take 3 to 14 days to stabilize. Over time, you can move toward automated methods that handle these shifts more seamlessly. For example, you could set up a rule to automatically cut the budget by 20% if ROAS drops below 4.0 for three days straight.
For even more control, use shared budgets in Google Ads. These allow the platform to automatically distribute funds across multiple campaigns based on performance.
Why It Matters
Real-time budget reallocation can lead to a 20–35% boost in ROAS. However, for campaigns with an 85%+ Impression Share, additional spending often delivers diminishing returns. In these cases, it’s better to pause further investment and focus on other opportunities. You can also apply the 70-20-10 allocation model mentioned earlier. Setting clear ROAS benchmarks is critical - for example, if a campaign falls below 50% of its target ROAS after spending twice the average CPA, it’s time to scale back its budget.
Lastly, monitor budgets daily instead of monthly. Auction dynamics and consumer behavior can shift quickly, and waiting weeks to reallocate funds could result in missed opportunities. Adjustments like refining geographic targeting based on conversion data can reduce wasted impressions by up to 40%.
3. Funnel-Stage Budget Segmentation
Funnel-stage budget segmentation is all about dividing your PPC budget across different stages of the sales funnel: Top of Funnel (TOFU), Middle of Funnel (MOFU), and Bottom of Funnel (BOFU). Each stage targets users based on their intent.
This approach works because it matches your offers to where your audience is in their buying journey. TOFU campaigns are ideal for building awareness, often featuring educational content like webinars or case studies. On the other hand, BOFU campaigns focus on high-intent users who are ready for demos or price quotes. Interestingly, campaigns targeting CRM-based audiences at the bottom of the funnel can convert 2-3 times better than those aimed at cold traffic. The key takeaway? Allocate your budget based on where users are in their decision-making process rather than spreading it evenly across all campaigns.
Implementation Complexity
To make this strategy work, a well-organized setup is essential. This means mapping every active campaign to a specific funnel stage and identifying baseline metrics for each. You'll also need robust conversion tracking and an attribution system that connects your ad platform data with CRM results. Without this connection, you risk underfunding MOFU campaigns that contribute to assisted revenue. TOFU campaigns, in particular, require a high volume of data - at least 100-200 clicks daily - to optimize effectively.
You can map campaigns to funnel stages by analyzing keyword intent. TOFU keywords typically have higher search volumes but lower conversion rates, while BOFU keywords focus on users closer to making a purchase, resulting in higher conversion rates.
Key Metrics to Track
Each funnel stage should have its own set of success metrics. For TOFU campaigns, focus on secondary conversion rates - the percentage of awareness clicks that eventually convert into leads through additional touchpoints. Don’t just measure cost per click; track how those clicks progress into qualified leads. For MOFU campaigns, monitor assisted conversions and engagement depth, such as visits to pricing pages versus bounces from the homepage. BOFU campaigns should prioritize lead quality and close rates. For example, a campaign generating $75 leads with a 25% close rate is far more effective than one producing $50 leads with only a 5% close rate.
"The foundation of effective budget allocation is building a reliable attribution framework that connects platform data with CRM outcomes... Without this connection, you're essentially flying blind."
- Lost & Found Marketing
Budget Allocation Impact
Once you've segmented campaigns by funnel stage, tailor your budget to their specific needs. Start by fully funding your bottom-funnel campaigns. Brand terms and high-intent service keywords should achieve maximum impression share before you allocate funds to awareness campaigns. BOFU campaigns are your revenue drivers, so prioritize them. If upper-funnel campaigns fail to show measurable results within 60-90 days, reallocate their budget.
For scaling, increase bottom-funnel budgets gradually - by 10-15% at a time - to avoid diminishing returns. MOFU budgets, however, can be adjusted weekly based on TOFU performance and seasonal trends, offering flexibility without disrupting your revenue flow.
Optimization Benefits
Segmenting your budget by funnel stage allows you to pinpoint where prospects drop off in their journey. This could reveal issues like high bounce rates on landing pages or weak engagement during the consideration phase. It ensures you don’t underfund high-performing BOFU campaigns while avoiding unnecessary spending on awareness efforts. When applied effectively, this strategy can boost ROAS by 20-35%.
Maintain minimum budgets for BOFU campaigns to keep revenue steady, even during slower periods. For remarketing, prioritize users based on their engagement level. For example, allocate higher bids to users who visited key pages like "Pricing" or "Request a Quote" rather than treating all site visitors equally.
sbb-itb-89b8f36
4. A/B Testing and Continuous Optimization
A/B testing takes your PPC strategy to the next level by replacing guesswork with data-driven insights. It allows you to validate every change with concrete evidence, helping you refine your campaigns for better results.
At its core, A/B testing is about running controlled experiments. Instead of relying on intuition, you test one variable at a time, splitting the budget evenly between the original (control) and the variation (experiment). By running the test until you achieve statistical significance, you build a database of proven strategies, where each successful test becomes the foundation for future improvements.
Implementation Complexity
Running a proper A/B test requires a structured approach. Start by defining a clear hypothesis, such as "Automated bidding will reduce CPA", and identify the key performance indicators (KPIs) you'll track to measure success. Next, create a duplicate campaign, making sure to modify only the variable you're testing - this could be a headline, a bid strategy, or a landing page. Launch the test alongside the control campaign, ensuring automated ad rotation is turned off to evenly distribute impressions.
To keep everything organized, use labels to track test launch dates and plan for tests to run for at least 2–6 weeks. Aim for a minimum of 5,000 impressions per variant to ensure your results are statistically reliable. Throughout the test, monitor the KPIs that align with your hypothesis to validate your findings.
Key Metrics to Track
The metrics you focus on will depend on what you're testing. For ad copy experiments, prioritize CTR (Click-Through Rate) to see which message resonates most with your audience. If you're testing landing page changes, Conversion Rate is the metric to watch. When experimenting with bid strategies, keep a close eye on CPA (Cost Per Acquisition) and ROAS (Return on Ad Spend).
However, don't overlook secondary metrics like Impression Share. For instance, if your CPA improves but your Impression Share dips below 80%, it could mean you're losing visibility. Setting clear thresholds before launching tests will help you avoid unintended consequences, like optimizing for cost efficiency at the expense of reach.
Budget Allocation Impact
A/B testing requires extra budget to ensure fair comparisons. For example, if your original campaign's monthly budget is $2,000, you'll need $4,000 to allocate evenly between the control and experimental campaigns. This ensures both versions get enough exposure to produce meaningful results.
When done right, A/B testing can lead to significant gains. Structured testing often delivers at least a 15% improvement in leads or sales from high-impact experiments. Mike Henderson, CMO of SuretyBonds.com, highlights its importance:
If you're tweaking title tags, meta descriptions and content for SEO, you should be testing your ad copy for PPC.
Optimization Benefits
The beauty of continuous testing is that it drives ongoing improvement. Each successful test becomes your new baseline, creating a cycle of growth where you build on past wins month after month. The most successful advertisers - those in the top 0.1% - test 10 times more than their peers, and their results reflect this commitment.
Beyond immediate performance boosts, A/B testing also helps Google's AI better understand your audience, leading to more efficient ad placements over time. To maximize the value of your efforts, document every test outcome in a shared database. This not only prevents redundant work but also showcases the impact of your marketing initiatives.
5. Gradual Scaling with Real-Time Budget Monitoring
This strategy works hand-in-hand with earlier methods, helping you avoid the pitfalls of sudden budget increases. Jumping your budget by more than 20–30% can trigger Learning Mode, a process that resets campaign performance and takes about seven days to recalibrate. During this adjustment phase, performance can fluctuate wildly, potentially wasting your budget.
Instead, a more controlled approach - scaling budgets incrementally while monitoring results in real time - yields better outcomes. For instance, rather than doubling your budget overnight, try increasing it by 10–20% daily or weekly. Tools like Marin, Adalysis, or Fluency can automate these adjustments, ensuring funds are quickly redirected from underperforming areas to high-ROAS campaigns. This steady method allows for precise execution and close tracking of results.
Implementation Complexity
To implement gradual scaling effectively, start by setting up reliable conversion tracking and defining clear performance benchmarks, such as maintaining an Impression Share above 80%.
Next, use rules-based automation to safeguard against performance dips. For example, you could create a rule like, "If ROAS drops below 4.0 for three consecutive days, reduce the budget by 20%." This type of automation helps protect your campaigns from slipping. For e-commerce advertisers, integrating budget monitoring with inventory management adds another layer of sophistication. This setup can automatically increase spending on high-margin, well-stocked products while scaling back on items with low inventory.
Key Metrics to Track
Your dashboard should focus on metrics that directly tie to business outcomes. Key indicators include ROAS, CPA, and conversion volume. Efficiency metrics like CPC trends and Impression Share are also crucial, especially for branded campaigns where maintaining visibility is a priority.
One particularly valuable metric is "marginal return", which measures the value generated by each additional dollar spent. Keeping tabs on marginal returns across campaigns helps identify where incremental budget increases will deliver the most impact.
Budget Allocation Impact
Once you’re tracking the right metrics, you can act quickly on your insights to protect your budget. Real-time monitoring enables what experts call "budget defense" - cutting spending on underperforming segments immediately. For instance, you could limit spend to ZIP codes with conversion rates above 3% or boost bids by 25% during peak hours (like 8 AM–2 PM for B2B campaigns) while scaling back during slower periods.
For B2B advertisers, a "Strong Finish" pacing strategy can be particularly effective. This involves allocating around 70% of your monthly budget to the final two weeks of the month, taking advantage of end-of-month conversion surges.
Optimization Benefits
When done right, gradual scaling paired with real-time monitoring can improve ROAS by 20–35% compared to static budget strategies. Combining AI-driven bid adjustments with manual efforts like negative keyword mining can also slash wasted spend by nearly 40%.
"The secret is incremental adjustments based on AI analysis of historical performance. I typically recommend 10–20% daily increases to high-performing campaigns to avoid triggering algorithmic instability."
– Magnet
With steady, data-driven adjustments, you can maximize gains while staying agile enough to adapt to market changes.
Framework Comparison Table
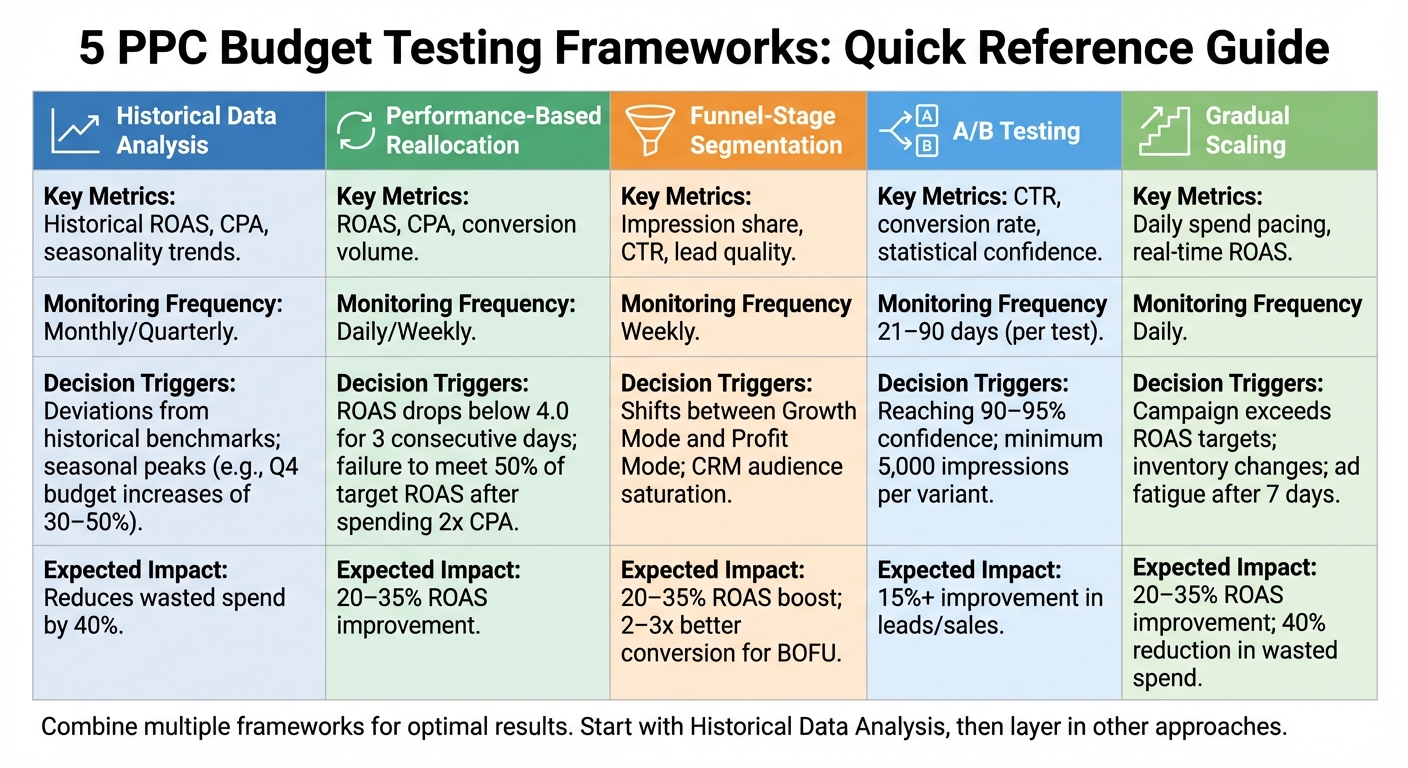
5 PPC Budget Testing Frameworks Comparison: Metrics, Frequency & Decision Triggers
The five frameworks outlined below are designed to operate on different timelines, each responding to specific performance signals. This table breaks down the key metrics, monitoring frequency, and decision triggers for each framework, making it easier to align your testing approach with your campaign goals and budget.
| Framework | Key Metrics | Monitoring Frequency | Decision Triggers |
|---|---|---|---|
| Historical Data Analysis | Historical ROAS, CPA, seasonality trends | Monthly/Quarterly | Deviations from historical benchmarks; seasonal peaks (e.g., Q4 budget increases of 30–50%) |
| Performance-Based Reallocation | ROAS, CPA, conversion volume | Daily/Weekly | ROAS drops below 4.0 for 3 consecutive days; failure to meet 50% of target ROAS after spending 2x CPA |
| Funnel-Stage Segmentation | Impression share, CTR, lead quality | Weekly | Shifts between Growth Mode (audience expansion) and Profit Mode (proven segments); CRM audience saturation |
| A/B Testing | CTR, conversion rate, statistical confidence | 21–90 days (per test) | Reaching 90–95% confidence; minimum 5,000 impressions per variant |
| Gradual Scaling | Daily spend pacing, real-time ROAS | Daily | Campaign exceeds ROAS targets; inventory changes; ad fatigue after 7 days |
Tailoring Frameworks to Campaign Scale
The scale of your campaign directly affects the testing timeframe. For smaller accounts spending around $800–$1,000 per month, Historical Data Analysis works best over a 60–90 day period. On the other hand, larger accounts with monthly budgets between $5,000 and $10,000 can make A/B Testing decisions in 21–30 days due to faster data accumulation.
Setting Data Thresholds
To avoid hasty decisions, it's crucial to establish minimum data thresholds. For accounts with low traffic, wait for at least 350 impressions and 7 conversions before declaring a winner. High-volume campaigns, however, can achieve statistically significant results in as little as one week, provided data collection is sufficient. A general rule of thumb is to conclude any test after three months to prevent overanalyzing.
Decision Triggers in Action
Each framework includes decision triggers to support ongoing budget optimization and performance improvements. For instance, Performance-Based Reallocation automatically cuts budgets by 20% after a three-day ROAS drop below 4.0. Meanwhile, Gradual Scaling increases budgets by 10–20% when campaigns exceed targets, avoiding disruptions caused by abrupt changes. In Funnel-Stage Segmentation, transitioning from Growth Mode to Profit Mode often reflects shifts in business priorities.
These decision triggers work as part of a broader strategy to ensure your campaigns remain agile and responsive throughout their lifecycle. By combining these frameworks with consistent monitoring, you can achieve more precise budget adjustments and better overall performance.
Conclusion
To optimize budget testing effectively, it's essential to build on the frameworks discussed earlier. Using integrated testing frameworks can lead to stronger results. Start by analyzing historical data to uncover trends that guide A/B testing efforts. Then, reallocate budgets based on performance, focusing on the winners identified during testing. Add real-time monitoring to ensure scaling efforts remain steady and effective. This step-by-step approach - from analyzing past data to making real-time adjustments - creates a cycle of continuous improvement. As Mike Henderson, CMO at SuretyBonds.com, puts it:
Once you get into an ad testing rhythm, there is a 'flywheel effect' in which you build off of successes to continue seeing better and better results.
To make this work, you’ll need to strike a balance between immediate performance and long-term growth. For example, set aside at least 10% of your ad spend for testing initiatives that aren’t tied to strict ROAS goals. This approach helps uncover impactful opportunities rather than settling for surface-level improvements.
Choose a testing framework that aligns with your campaign size and monthly budget. Keep detailed records of your tests to avoid repeating mistakes or missing key insights. Art Zabalov from Art Does Ads explains:
By performing consecutive... A/B testing we're creating footholds, from which we can keep 'climbing' and refining the accounts based on our learnings.
When scaling successful campaigns, aim to increase budgets by about 15% each week to maintain stability.
The best advertisers combine machine learning with human judgment. AI can handle real-time bid adjustments, while human expertise focuses on tasks like identifying negative keywords - a tactic that can reduce wasted spend by nearly 40%. As your campaigns grow and evolve, let the insights from your data guide your testing strategy to ensure it matures alongside your budget.
FAQs
How can I use past campaign data to optimize my PPC budget?
To make smarter budgeting choices, start by diving into at least 90 days of historical campaign data - or even longer if you're dealing with seasonal trends. Break this data down by channel, campaign, device, and location. Then, calculate key metrics like return on ad spend (ROAS) and cost per acquisition (CPA). These numbers will highlight which areas deliver the strongest results.
A simple formula can help you establish a baseline budget:
Budget = (Target Revenue ÷ Historical ROAS) × 1.2
That 1.2 multiplier? It acts as a buffer for fluctuations and gives you room to test incremental improvements. From there, allocate your budget strategically:
- 40–60% to your top-performing segments
- 20–30% to experimental efforts
- 10–20% to niche opportunities
You can refine this further by analyzing historical data for patterns related to time-of-day and geographic performance. For instance, if certain times or locations consistently underperform, reduce spending in those areas. Instead, shift those funds toward campaigns or regions that are exceeding their ROAS targets.
For an extra edge, consider using AI-powered tools to automate budget adjustments. These tools can respond to real-time data, helping you optimize spending and improve overall campaign efficiency.
What are the advantages of using budget segmentation based on funnel stages in PPC campaigns?
Segmenting your PPC budget by funnel stages - awareness, consideration, and conversion - helps you distribute your ad spend more effectively. This ensures that high-intent, bottom-of-funnel campaigns have the funding they need to drive sales, while top-of-funnel efforts are adequately supported to bring in and qualify fresh leads.
This strategy also simplifies tracking performance at each stage, making it easier to pinpoint issues and reallocate budgets based on real-time data. By matching your spending to customer intent, you can stretch your budget further, cut down on wasted spend, and build a campaign strategy that’s both flexible and results-focused.
How does gradually increasing a campaign budget with real-time monitoring improve performance?
Gradually increasing your campaign budget in small, controlled increments allows you to explore higher spending levels while minimizing risk. When you combine this method with real-time monitoring, you can keep a close eye on key performance metrics like click-through rate (CTR), cost-per-click (CPC), conversion rate, and return on ad spend (ROAS) as they shift. This approach helps you spot and address any performance dips early, preventing potential issues from spiraling out of control.
Real-time tools can further enhance this strategy by automatically shifting budget away from ads that aren’t performing well and toward those that are driving better results. By consistently analyzing performance and making data-backed adjustments, you can fine-tune your spending to scale efficiently without sacrificing profitability - and potentially even improve it.