If you're running ads on platforms like Google, Meta, or TikTok, you've probably noticed this issue: each platform claims more conversions than your actual sales - sometimes 2x to 4x higher. This happens because every platform uses its own logic to report results, often double-counting conversions. The solution? Cross-platform attribution. It helps you assign credit accurately across all touchpoints in a buyer’s journey, ensuring smarter budget decisions and better ROI tracking.
Key Takeaways:
- Why It Matters: Without cross-platform attribution, you risk over-investing in platforms that over-report conversions and underfunding those driving real growth.
- Best Attribution Models:
- Single-Touch: Simple but incomplete; often favors last-click channels like search.
- Multi-Touch: Spreads credit across touchpoints; improves ROI accuracy by 37%.
- Data-Driven: Uses machine learning for precise credit allocation; best for campaigns with 300+ monthly conversions.
- Metrics to Watch:
- ROI: Includes all costs, not just ad spend.
- LTV by Source: Reveals which channels drive long-term customer value.
- Incremental Lift: Measures how many sales your ads directly caused.
- Tools to Use: Google Analytics 4 (GA4), CRM platforms like HubSpot, and specialized tools like Northbeam or Synter for unified reporting.
Quick Tip:
Start by centralizing all your data - ad spend, clicks, and revenue - and use neutral tools like GA4 to avoid inflated metrics. This ensures your budget decisions are based on reality, not over-reported numbers.
This guide explains how to pick the right models, track key metrics, and use tools effectively to measure and improve ROI across platforms.
Marketing Analytics: Cross Channel Attribution
sbb-itb-89b8f36
Attribution Models and Their Role in ROI Measurement
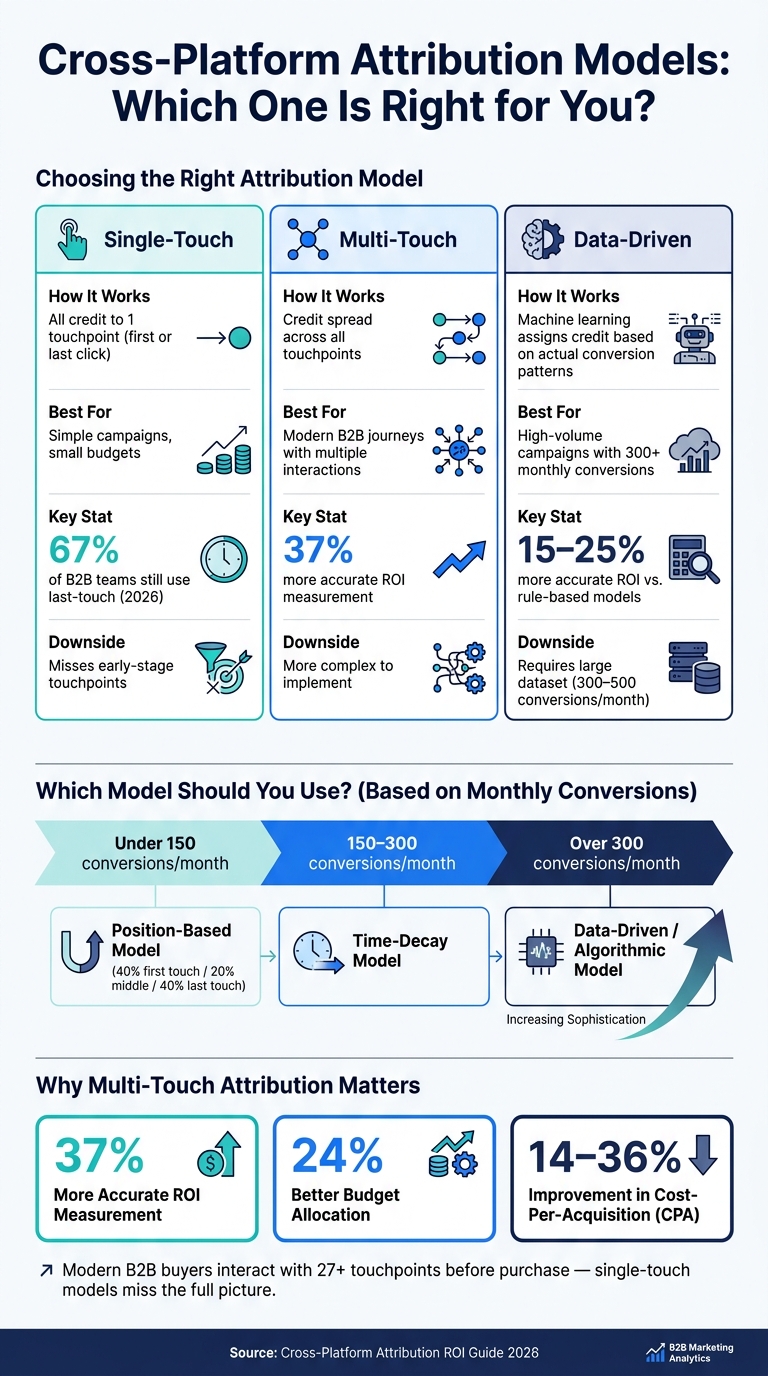
Cross-Platform Attribution Models: Which One Is Right for You?
The attribution model you choose has a direct impact on how you interpret ROI and allocate your budget. Missteps here can lead to underfunding early-stage awareness campaigns or overemphasizing last-click channels. This section lays the groundwork for exploring the metrics and tools needed for effective cross-platform ROI tracking.
Single-Touch vs. Multi-Touch Attribution Models
Single-touch models, like first-click and last-click, assign all conversion credit to just one interaction. While they’re straightforward and easy to explain, they often provide an incomplete picture. Take last-click attribution, for example - it gives all the credit to the final interaction, favoring bottom-funnel channels such as branded search. This approach can overlook the importance of early-stage campaigns that initially engaged the customer. Despite these shortcomings, 67% of B2B marketing teams still rely on last-touch attribution as of 2026.
On the other hand, multi-touch attribution (MTA) spreads credit across all touchpoints in the customer journey. This is especially relevant since modern B2B buyers interact with over 27 touchpoints before making a purchase. Companies adopting MTA report 37% more accurate ROI measurement, 24% better budget allocation, and a 14%–36% improvement in cost-per-acquisition (CPA).
Here’s a quick guide to help determine the best model based on your conversion volume:
| Monthly Conversions | Recommended Model |
|---|---|
| Fewer than 150 | Position-Based (40% first/last, 20% middle) |
| 150–300 | Time-Decay |
| More than 300 | Data-Driven / Algorithmic |
Data-Driven Attribution for More Accurate ROI
Data-driven attribution (DDA) takes a more advanced approach by using machine learning to assign credit based on actual conversion patterns. Instead of defaulting to first or last clicks, DDA calculates the "removal effect" - essentially, it measures how much the likelihood of conversion drops if a specific touchpoint is removed from the customer journey. This makes it especially sensitive to the touchpoints that genuinely influence buyer behavior.
"Data-driven models have the potential to be the most accurate because they are calibrated to your actual data rather than theoretical assumptions." - KISSmetrics Editorial
DDA often delivers 15% to 25% more accurate ROI measurements compared to rule-based models. However, it’s worth noting that this model works best with a robust dataset; most experts suggest at least 300 to 500 conversions per month to ensure reliable outputs. In fact, Google Analytics 4 has made data-driven attribution the default setting, removing other options like first-click, linear, time-decay, and position-based models as of late 2023.
That said, no attribution model can succeed without accurate tracking. As House of MarTech aptly puts it, "The model choice matters less than the data the model runs on". If your tracking only captures form submissions instead of revenue logged in your CRM, even the most advanced model could lead you astray. Up next, we’ll dive into the key metrics and tools that can help refine ROI tracking even further.
Key Metrics and Tools for Cross-Platform ROI Tracking
A successful attribution model hinges on tracking the right metrics. It's not just about collecting data - it's about understanding which numbers matter and using them to make smarter decisions.
Core ROI Metrics for Cross-Platform Campaigns
Many marketers rely on ROAS (Return on Ad Spend) as their go-to metric. While useful, ROAS only compares revenue to ad spend, ignoring key costs like agency fees, often managed by specialized PPC agencies, software subscriptions, creative production, and team hours. ROI, on the other hand, factors in all these expenses, making it a more accurate measure for budget planning. Overlooking these "hidden" costs can lead to underestimating total expenses by 40% to 60%.
Another critical metric is Customer Lifetime Value (LTV) by source. Two channels might show similar CPAs (Cost Per Acquisition), but the long-term value of customers from each could be vastly different. Tracking LTV by ad source helps identify which channels are driving real growth - not just filling the top of the funnel. Aligning these metrics across platforms ensures that ROI insights translate into smarter budget allocation.
Incremental lift is another must-watch metric. While basic attribution shows correlation, incrementality digs deeper, measuring how many conversions your ads directly caused versus those that would have happened anyway. From this, you can calculate True CPA - dividing attributed CPA by the incrementality percentage. This reveals the actual cost of acquiring customers influenced by your marketing efforts.
"Every ad platform wants you to believe it deserves more of your budget. Facebook claims credit for conversions that Google also claims." - KISSmetrics Editorial
To avoid falling for inflated numbers, track an inflation factor. This involves comparing reported conversions from platforms like Meta or Google against a neutral source like GA4. It's a simple yet effective way to validate data before making budget decisions.
| Metric | What It Measures | Best Used For |
|---|---|---|
| ROAS | Revenue / Ad Spend | Daily ad and creative optimization |
| ROI | (Revenue - Total Costs) / Total Costs | Strategic budget planning |
| LTV by Source | Long-term revenue per acquired customer | Evaluating channel quality over time |
| True CPA | Attributed CPA / Incrementality % | Cost of conversions your ads actually caused |
| Inflation Factor | Platform conversions vs. GA4 conversions | Identifying over-reporting by ad platforms |
These metrics lay the groundwork for understanding campaign success. The next step is choosing the right tools to measure them consistently and accurately.
Attribution Tracking Tools Overview
No single tool can do it all, but several stand out for cross-platform tracking. Google Analytics 4 (GA4) is a strong choice for its consistent attribution logic, acting as a neutral referee when platforms report conflicting conversion data. Its default data-driven attribution makes it particularly reliable for analyzing performance across channels.
For businesses needing to tie ad performance to revenue, CRM integration is key. Tools like HubSpot and Salesforce allow you to track clicks all the way to closed deals. A common setup involves using Google Tag Manager (GTM) to capture UTM parameters and Google Click IDs (GCLIDs), passing them into hidden CRM fields to maintain the attribution chain from click to sale.
E-commerce and direct-to-consumer brands often benefit from platforms like Northbeam, Triple Whale, and Rockerbox. These tools come with pre-built integrations, eliminating the need for custom data warehouses. Another option is Synter, which uses AI-driven prompts to generate unified reports across 14 platforms, including Meta, TikTok, and LinkedIn. Pricing starts at $199/month.
"If you are making budget allocation decisions based on platform-reported CPA, you are making decisions on inflated numbers." - Synter Media
Standardizing attribution windows across platforms is also critical. For example, set Meta to a 7-day click window to ensure data comparability.
How to Calculate Cross-Platform ROI: A Step-by-Step Framework
Data Collection and Integration
To get started, you need to centralize your data. This means pulling information from ad platforms (like spend and clicks), analytics tools (to track on-site behavior), your CRM (for leads and closed revenue), and a data warehouse to serve as your single source of truth. The goal is to connect these layers seamlessly.
The first step in this process is ensuring your data is accurate. One way to do this is by calculating your Overlap Coefficient. This is done by dividing the total conversions reported by platforms by the actual orders recorded in your CRM or backend system. Here’s a quick guide to interpreting the results:
- A coefficient above 1.3 suggests heavy double-counting. For example, if a customer interacts with TikTok, Meta, and Google, each platform might claim full credit for the same sale.
- A coefficient below 0.8 points to data loss, which is often caused by ad blockers or privacy measures like iOS tracking opt-outs. Around 65–75% of iOS users choose to opt out.
"This is not a reporting problem. It is an integration problem. And it is costing you real money." - House of MarTech
To fix data loss, you can use server-side tracking tools such as Meta’s Conversions API (CAPI), Google Enhanced Conversions, or TikTok Events API. Combine this with a standardized UTM structure by including a utm_id field that dynamically pulls the campaign ID (e.g., utm_id={{campaign.id}}). Then, normalize your data by:
- Aligning metric definitions (e.g., Meta counts "all clicks", while Google counts "link clicks").
- Converting all numbers to USD.
- Mapping campaign names to a unified naming system.
ROI Calculation Methods
Once your data is centralized, calculating ROI becomes simpler. The basic formula is (Revenue − Total Costs) ÷ Total Costs. Be sure to include all costs - agency fees, software subscriptions, creative production, and even team hours. Skipping these can lead to inflated ROI figures by 2x or 3x.
For a broader perspective, use the Marketing Efficiency Ratio (MER). This metric divides your total backend revenue (from your CRM) by your total ad spend across all channels. MER acts as a sanity check - if platform-reported ROAS looks great but MER is declining, it’s a sign that attribution might be over-crediting certain channels.
Here’s a quick breakdown of key approaches:
| Approach | Formula | Best Used For |
|---|---|---|
| Standard ROI | (Revenue − Total Costs) ÷ Total Costs | Strategic budget planning with all costs included |
| MER | Total Revenue ÷ Total Ad Spend | Cross-platform checks without attribution issues |
| Blended ROAS | Total CRM Revenue ÷ Total Ad Spend | Unified performance view across multiple channels |
For businesses with at least 300–400 monthly conversions, data-driven attribution (DDA) delivers the most reliable results. But if you’re working with smaller accounts or longer sales cycles (like in B2B), a position-based model is a good starting point. This model assigns:
- 40% credit to the first touch.
- 40% credit to the last touch.
- The remaining 20% is evenly distributed across other interactions.
This method proved effective in a 2026 case study involving an industrial manufacturing company working with Marqeu. By switching from first-click attribution to a position-based model, they discovered that performance marketing contributed 3.2x more pipeline value than previously recorded. After reallocating their budgets based on these insights, they saw a 47% increase in qualified pipeline within two quarters.
Finally, ensure you send conversion data back to platforms as quickly as possible - ideally within one hour. Tools like Google’s Performance Max and Meta’s Advantage+ depend on near-real-time data for bid optimization. Delays beyond 12 hours can significantly hurt platform AI performance.
Using Top PPC Marketing Directory to Improve ROI
Finding the Right Tools and Agencies
Accurate ROI evaluation depends heavily on neutral, comprehensive data. The Top PPC Marketing Directory simplifies this by consolidating various tracking systems into one reliable resource. Since platform-specific attribution windows often inflate conversion metrics, choosing independent tools for measurement is a must.
This directory links marketers to neutral attribution tools that work independently of ad platforms. These tools use trusted data sources like Google Analytics 4 to eliminate duplicate conversions. When browsing the directory, focus on tools that integrate seamlessly across multiple platforms. For example, Synter supports 14 platforms, including Google, Meta, TikTok, Reddit, and Amazon DSP. It even offers free GA4 reporting tools, with more advanced cross-platform reporting starting at $199 per month. This integration not only simplifies conversion tracking but also lays the groundwork for optimizing campaign performance with expert guidance.
"Allocating more budget to the platform with the best reported CPA - without a neutral attribution source - means concentrating spend on whichever platform claims the most credit, not whichever platform is actually driving the most incremental conversions." - Synter Media
Using Directory Resources to Support Campaign Performance
The directory isn't just about tools - it’s also a hub for finding agencies and services that handle the technical side of attribution setup. Tasks that typically take hours, like setting up Google Tag Manager or configuring Meta Pixel events, can often be completed in just 30 minutes with these solutions.
Additionally, the directory offers resources to enhance performance tracking. These tools help teams apply best practices, like calculating inflation factors and standardizing attribution windows across platforms, without having to build processes from scratch. By combining these resources with the methodologies discussed earlier, teams can ensure more accurate ROI calculations and better-integrated attribution systems.
Common Cross-Platform Attribution Mistakes and How to Fix Them
Underestimating Data Integration Complexity
One of the biggest pitfalls in cross-platform attribution is treating platform-reported conversions as independent numbers. When multiple platforms claim credit for the same purchase, the result can inflate your sales figures by two to four times the actual total.
To identify this issue, calculate your overlap coefficient by dividing the total conversions reported by platforms by your actual sales. If the result is over 1.3, you’re likely dealing with significant double-counting and need to address it with integrated data de-duplication. Fixing this involves three key steps: collecting raw data via platform APIs, normalizing and de-duplicating it, and consolidating everything into a single dashboard for clearer budgeting decisions.
Another challenge is the loss of visibility caused by tracking opt-outs, especially among iOS users - about 65% to 75% choose not to be tracked. This makes standard browser pixels less effective. Tools like Meta's Conversions API (CAPI) or Google Enhanced Conversions can help recover this missing data and improve the quality of signals your ad algorithms depend on.
Channel fragmentation is another common issue caused by inconsistent UTM naming. For instance, tagging a campaign as utm_source=google versus utm_source=Google_Ads leads analytics tools to treat them as separate channels. A unified naming convention prevents this confusion and ensures cleaner data.
But collecting accurate data is just the first step. The real value lies in interpreting and acting on these insights to optimize your return on investment.
Misreading Attribution Data
Even with clean, well-integrated data, misinterpreting attribution metrics can lead to poor decisions. One common mistake is over-prioritizing bottom-funnel channels like branded search and retargeting because they show strong last-touch results. This often leads to cutting awareness campaigns that initially drove demand, which can weaken your overall sales pipeline over time.
"The goal is not perfect attribution. It is attribution that is reliable enough to guide better decisions than you are making now." - House of MarTech
For data-driven attribution models to work effectively, you need at least 300 to 400 monthly conversions. If your numbers fall short, position-based or time-decay models are more reliable alternatives. To validate your attribution model, consider running holdout tests. For example, pause ads for 10% to 20% of your audience for a set period and observe the impact on conversions. If your model claims a channel drives 30% of revenue but pausing it barely affects results, it’s time to reassess.
Conclusion: Getting More ROI from Cross-Platform Attribution
Cross-platform attribution is no longer just a convenience - it’s become a critical component of growth strategies. As Sushil Goel from LayerFive explains, "Marketing attribution has evolved from a nice-to-have reporting feature into mission-critical growth infrastructure." Without this infrastructure, your budget decisions might rely on inflated metrics - sometimes 2–4x higher than the actual results.
The main takeaway here is simple: a neutral source of truth transforms everything. By moving away from platform-specific dashboards and embracing a unified, de-duplicated data layer, you can allocate budgets more effectively, make faster decisions, and achieve sharper ROI accuracy. Studies reveal that unified data analytics can boost decision-making speed by 40% and improve ROI accuracy by 30%. These are not minor improvements - they can be the difference between confidently scaling campaigns and operating on guesswork.
Here’s a practical insight: ROI improvements from integrated cross-platform management often become visible within 8 to 12 weeks of implementation. That’s a relatively short timeframe to start seeing meaningful results, assuming your data foundation is solid from the outset.
If you’re exploring tools or agencies to help establish that foundation - whether it’s server-side tracking, identity resolution, or automated bid management - Top PPC Marketing Directory is a helpful resource. This curated directory lets you compare vetted PPC tools and agencies specializing in performance tracking and campaign management.
The aim isn’t perfect attribution - it’s attribution that’s reliable enough to guide smarter decisions. With this framework, you’re equipped to make that happen.
FAQs
How do I know if my ad platforms are double-counting conversions?
To identify double-counting, compare the total conversions reported by all platforms to your actual sales using an overlap coefficient. If this coefficient exceeds 1 by a noticeable margin (e.g., 1.2), it’s a red flag for inflated metrics. Investigate tracking gaps and examine how each platform attributes conversions, as overlapping attribution windows often lead to discrepancies. Implementing a unified tracking system can help streamline attribution and lead to more informed budgeting decisions.
What attribution model should I use if I have fewer than 300 conversions a month?
If your monthly conversions fall below 300, using a single-touch attribution model - like first-touch or last-touch - works best. These models are straightforward to set up and offer clear, actionable insights, making them a smart choice for smaller conversion volumes.
How can I calculate ROI when revenue lives in my CRM, not my ad platforms?
To figure out ROI when your revenue data is stored in a CRM, you need to integrate that CRM data with your attribution system. Start by linking your CRM to analytics tools and ad platforms. This way, you can unify your data and ensure conversions are properly assigned across all channels.
Leverage multi-touch attribution models to give credit to each touchpoint along the customer journey. Once you've attributed revenue to the right channels, calculate ROI by dividing the attributed revenue by your ad spend. This approach gives you a clear view of performance across platforms and the entire customer journey.