Return on Ad Spend (ROAS) measures how much revenue you earn for every dollar spent on advertising. It's simple to calculate and crucial for understanding your campaign's profitability:
- Formula: ROAS = Revenue ÷ Ad Costs
- Example: If you spend $5,750 on ads and generate $25,000 in revenue, your ROAS is 4.35 (or $4.35 earned per $1 spent).
Why ROAS Matters:
- Profitability: Know if your campaigns are making money.
- Budgeting: Allocate funds to high-performing campaigns.
- Optimization: Adjust underperforming ads to improve returns.
Quick Tips:
- Track all ad-related costs (e.g., clicks, agency fees, tools).
- Use tools like Google Ads or Excel for easy ROAS tracking.
- Compare your ROAS against industry benchmarks (e.g., Retail: 4:1, B2B Tech: 5:1).
Focus on ROAS to ensure your advertising dollars drive real revenue.
How to Calculate ROAS in Google Ads (And Why It's Important)
Understanding ROAS Basics
Return on Ad Spend (ROAS) connects your advertising costs to the revenue they generate, offering a clear view of how effectively your ad budget is working. Think of it as a performance report for your ad spend, helping you allocate resources, evaluate campaigns, and plan finances with confidence.
ROAS vs. Basic PPC Metrics
Metrics like Click-Through Rate (CTR) and Cost-Per-Click (CPC) provide useful insights, but they don’t give the full picture. Here’s how ROAS stands apart:
| Metric | What It Measures | Business Impact |
|---|---|---|
| ROAS | Revenue generated per ad dollar spent | Shows financial return directly |
| CTR | Percentage of users who click ads | Reflects ad relevance and appeal |
| CPC | Cost paid for each ad click | Tracks the cost of driving traffic |
ROAS answers the critical question: "Is this campaign profitable?" Unlike CTR or CPC, which focus on engagement or cost, ROAS zeroes in on financial performance.
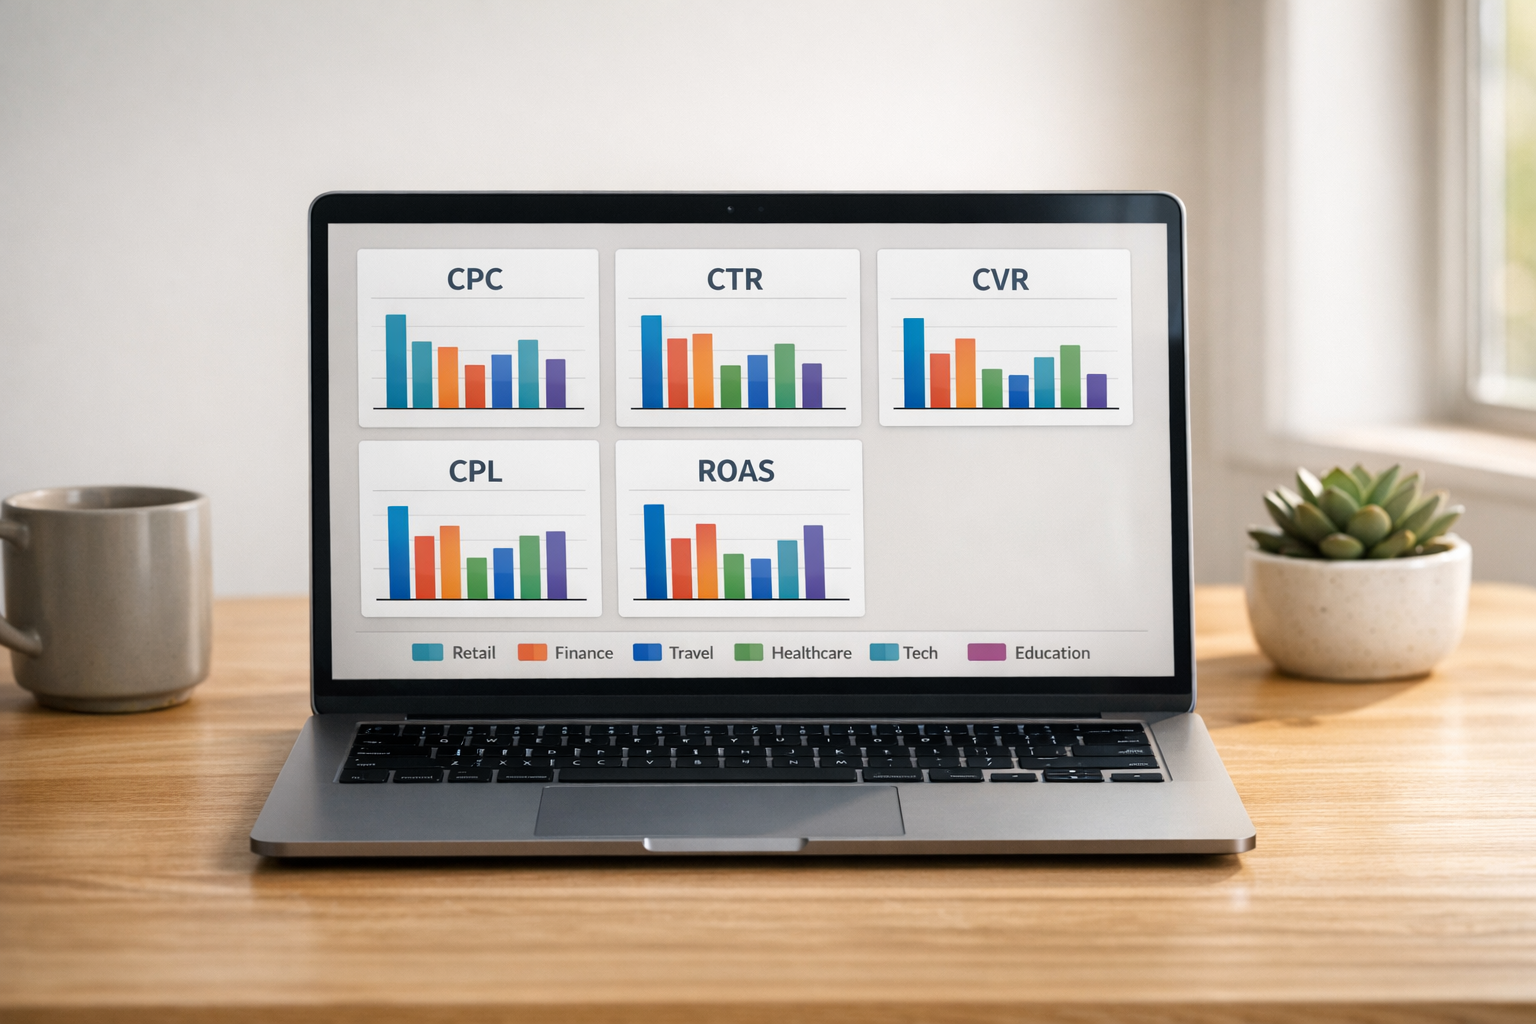
The Top PPC Marketing Directory provides specialized tools to track ROAS alongside other metrics, giving you a complete view of your campaign. Monitoring ROAS together with CTR and CPC allows you to:
- Spot Revenue Trends: Identify which campaigns are driving the most revenue.
- Refine Ad Budgets: Allocate spending based on actual returns.
- Grow Effectively: Scale up successful campaigns while cutting back on those that underperform.
While CTR and CPC are great for fine-tuning campaign elements, ROAS ensures your strategy is focused on what truly matters: generating revenue. It’s a must-have metric for any business looking to make the most of its advertising dollars.
ROAS Calculation Steps
To calculate ROAS (Return on Ad Spend), divide the revenue generated by the total advertising costs. This metric helps measure how well your PPC campaigns turn ad spend into revenue.
Basic ROAS Formula
ROAS = Revenue ÷ Advertising Costs
Here’s how to apply the formula:
- Track Revenue: Gather all revenue directly tied to your PPC campaign.
- Include Ad Costs: Account for all expenses, such as:
- Click costs
- Agency fees
- Creative production expenses
- Campaign management tools
Sample ROAS Calculation
Let’s break it down with an example:
| Campaign Component | Amount |
|---|---|
| Total Revenue | $25,000 |
| Ad Spend | $5,000 |
| Agency Fees | $500 |
| Tool Costs | $250 |
| Total Ad Costs | $5,750 |
Now, calculate ROAS:
ROAS = $25,000 ÷ $5,750 = 4.35
This result means the campaign generated $4.35 for every dollar spent on advertising.
To ensure your ROAS calculation is accurate:
- Include all types of conversions, such as online purchases, phone orders, or in-store visits driven by your ads.
- Factor in every related cost.
- Use analytics tools and sales records to track revenue and verify your data.
Reading ROAS Numbers
Understanding ROAS helps you evaluate whether your PPC campaigns are hitting their goals. To do this effectively, consider both industry benchmarks and your business model.
Target ROAS by Industry
Here’s a breakdown of common ROAS targets by industry to help you assess your campaign’s performance:
| Industry | Average ROAS | Competitive Range |
|---|---|---|
| Retail/eCommerce | 4:1 | 3:1 - 6:1 |
| B2B Technology | 5:1 | 4:1 - 8:1 |
| Healthcare | 3:1 | 2.5:1 - 4:1 |
| Financial Services | 7:1 | 5:1 - 10:1 |
| Consumer Services | 3.5:1 | 2:1 - 5:1 |
These numbers serve as general benchmarks. Your ideal ROAS depends on factors like your pricing, operational costs, and business goals.
Minimum ROAS Requirements
To set a minimum ROAS for your campaigns, you’ll need to analyze your costs and profit margins closely. Here’s how to approach it:
- Profit Margins: For a 40% profit margin, a ROAS of about 2.5:1 ensures profitability.
- Fixed Costs: Account for overhead expenses, salaries, platform fees, and software subscriptions.
- Break-Even Analysis: Use this formula: 100 ÷ Profit Margin (e.g., a 25% margin requires a ROAS of 4:1 to break even).
- Seasonal Adjustments: Adjust your targets to account for seasonal trends, aiming higher during peak periods and lower during slower times.
sbb-itb-89b8f36
ROAS Tracking Tools
Once you've calculated your ROAS, it's important to keep monitoring and fine-tuning your campaign performance. Here are some tools and methods to help you stay on top of your ROAS.
Google Ads ROAS Features
Google Ads includes built-in ROAS tracking through its conversion tracking system. Here's how to set it up:
- Navigate to Tools & Settings > Conversions.
- Enable value tracking for your conversion actions.
- Configure transaction-specific values or assign fixed values to conversions.
- Access ROAS data in the Campaigns tab under the Conv. value/cost column.
For more advanced insights, integrate Google Analytics 4 with Google Ads to create custom ROAS reports.
ROAS Calculator Tools
Specialized tools listed in the Top PPC Marketing Directory can simplify tracking your campaign's performance. These tools typically offer:
- Real-time ROAS calculations
- Multi-channel attribution modeling
- Custom reporting dashboards
- Automated performance alerts
- Historical trend analysis
Using these tools can help validate your ROAS calculations and make it easier to adjust your campaigns effectively.
Excel ROAS Tracking
If you prefer a hands-on approach, you can create a custom ROAS tracking spreadsheet in Excel. Here's how:
-
Set Up Your Spreadsheet
Create columns for the following data:- Campaign Name
- Ad Spend
- Revenue
- ROAS
- Date
-
Input the ROAS Formula
Use this formula to calculate ROAS:=IF(B2=0,"No Spend",C2/B2)- B2 refers to the Ad Spend cell.
- C2 refers to the Revenue cell.
-
Add Visualizations
Enhance your spreadsheet with tools like pivot tables and charts to display:- Campaign performance trends
- Weekly or monthly ROAS comparisons
- Correlation between ad spend and revenue
Here’s an example of how you can structure your Excel workbook:
| Sheet Component | Purpose | Formula/Setup |
|---|---|---|
| Summary Tab | Campaign overview | =SUMIF(range, criteria, sum_range) |
| Daily Tracker | Day-to-day monitoring | =TODAY() for date stamping |
| Performance Dashboard | Visual reporting | Pivot tables + charts |
This manual tracking method complements automated tools, giving you a more detailed view of your campaign's performance.
ROAS Improvement Methods
Building on ROAS tracking and analysis, these methods aim to directly boost performance.
Campaign Performance Updates
Regularly reviewing campaign performance helps identify where to allocate resources for better results. Move budget from underperforming areas to those delivering strong returns.
Key metrics to monitor include:
- CTR (Click-Through Rate)
- Conversion Rate
- CPA (Cost Per Acquisition)
This approach lays the groundwork for improving ad quality and overall efficiency.
Ad Quality Optimization
Improving ad quality works hand-in-hand with budget adjustments by cutting costs and driving more engagement.
- Creative Adjustments: Use dynamic creatives to increase conversions and reduce costs.
- Landing Page Tweaks: Ensure your landing pages are on point - messaging should match the ad, load times should be under 3 seconds, and calls-to-action should be clear and visible above the fold. Test different layouts to find what works best.
Bid Strategy Optimization
Fine-tuning your bid strategy can significantly impact campaign performance. Here's a quick guide:
| Bid Strategy Type | Best Used For | Expected Impact |
|---|---|---|
| Target ROAS | Established campaigns with conversion data | Automates bids based on the likelihood of conversions |
| Enhanced CPC | New campaigns building conversion data | Combines automation with some manual bid control |
| Portfolio Strategy | Campaigns sharing similar goals | Balances optimization across multiple campaigns |
Performance-Based Adjustments
- Adjust bids by device based on how each performs for ROAS.
- Use geographic data to tweak location-based bids.
- Modify audience bid multipliers depending on conversion rates.
Keep these adjustments aligned with current ROAS trends to ensure campaigns stay profitable and effective.
Conclusion
To boost PPC profitability, focus on consistent ROAS tracking and making strategic adjustments. These steps are key to spotting underperforming campaigns and making data-driven improvements.
Here’s what to prioritize:
- Regularly analyze campaign performance
- Use data to fine-tune targeting and bidding strategies
- Keep up with the latest PPC trends and methods
ROAS is a critical metric for measuring success and profitability. Whether you're managing search, display, or social media campaigns, maintaining a strong ROAS demands continuous monitoring and adjustments. A mix of automation tools and human oversight often delivers the best results.
FAQs
How do I calculate the minimum ROAS needed to make my PPC campaigns profitable?
To calculate the minimum Return on Ad Spend (ROAS) required for profitability, start by identifying your profit margin. This is calculated as:
Profit Margin = (Revenue - Costs) / Revenue
Next, use the formula:
Minimum ROAS = 1 / Profit Margin
For example, if your profit margin is 25% (0.25), the minimum ROAS needed to break even would be:
1 / 0.25 = 4.0
This means you need to generate at least $4 in revenue for every $1 spent on ads to cover costs and avoid losses. Adjust this calculation based on your specific business model, costs, and goals to ensure your campaigns are not only breaking even but also driving profit.
What are the best ways to track and analyze ROAS for PPC campaigns over time?
To effectively track and analyze ROAS (Return on Ad Spend) for your PPC campaigns, you can use tools that provide comprehensive performance insights. These tools often help you measure ad spend, revenue generated, and other key metrics in real-time. Look for solutions with features like detailed reporting, customizable dashboards, and integration with your advertising platforms.
Some popular choices include analytics platforms like Google Analytics, ad network dashboards (e.g., Google Ads or Facebook Ads Manager), and specialized PPC management tools. Many of these tools allow you to monitor trends over time, perform A/B testing, and adjust strategies to maximize your ROAS. By leveraging these tools, you can gain deeper insights into your campaign performance and make data-driven decisions to optimize your marketing efforts.
What is ROAS, and how is it different from metrics like CTR and CPC in measuring PPC campaign success?
ROAS (Return on Ad Spend) measures the revenue generated for every dollar spent on advertising, making it a key indicator of a campaign's profitability. Unlike CTR (Click-Through Rate), which tracks how often people click on your ads, or CPC (Cost Per Click), which measures the cost of each click, ROAS directly ties ad performance to financial outcomes.
ROAS is considered more crucial for evaluating success because it focuses on the actual return on your investment, helping you understand whether your campaign is driving meaningful revenue. While CTR and CPC provide valuable insights into engagement and cost efficiency, ROAS gives a clearer picture of overall campaign effectiveness and profitability.