Most mobile benchmark mistakes come from using the wrong comparison. Mobile gets more traffic, but it does not always convert better - and the gap changes by channel, industry, and funnel stage.
If I had to boil this article down to a few points, it would be this:
- Mobile traffic is high, but mobile CVR is context-based.
- Desktop still beats mobile on many landing pages because forms, checkout, and payment steps are harder on smaller screens.
- Some sectors flip that pattern, especially finance and legal, where people often act fast on their phones.
- Email and paid search usually beat paid social unless social traffic comes from retargeting.
- Blended averages are risky because a purchase rate, lead rate, and phone-call conversion rate are not the same metric.
- Speed and checkout friction do a lot of the damage on mobile.
- A 90-day internal baseline by device, channel, page, and funnel step gives you a better read than a broad market average.
Here’s the short version: if you compare cold paid social to branded search, or compare form fills to purchases, you can end up making the wrong call. That is the main point of the article.
A quick snapshot:
| Area | What matters most |
|---|---|
| Device | Mobile gets more visits, but desktop often converts better |
| Channel | Email and paid search tend to show stronger CVR than cold social |
| Industry | Finance and legal can do well on mobile; travel often does not |
| Funnel | Load time, cart friction, and checkout drop-off shape results |
| Reporting | Track calls, forms, and purchases with the same rules over time |
If you want a clean takeaway, it is this: use benchmarks as a sense-check, not a target. I would segment by intent, audience warmth, and funnel step before judging whether mobile performance is good or bad.
Mobile Conversion Benchmarks by Device and Channel
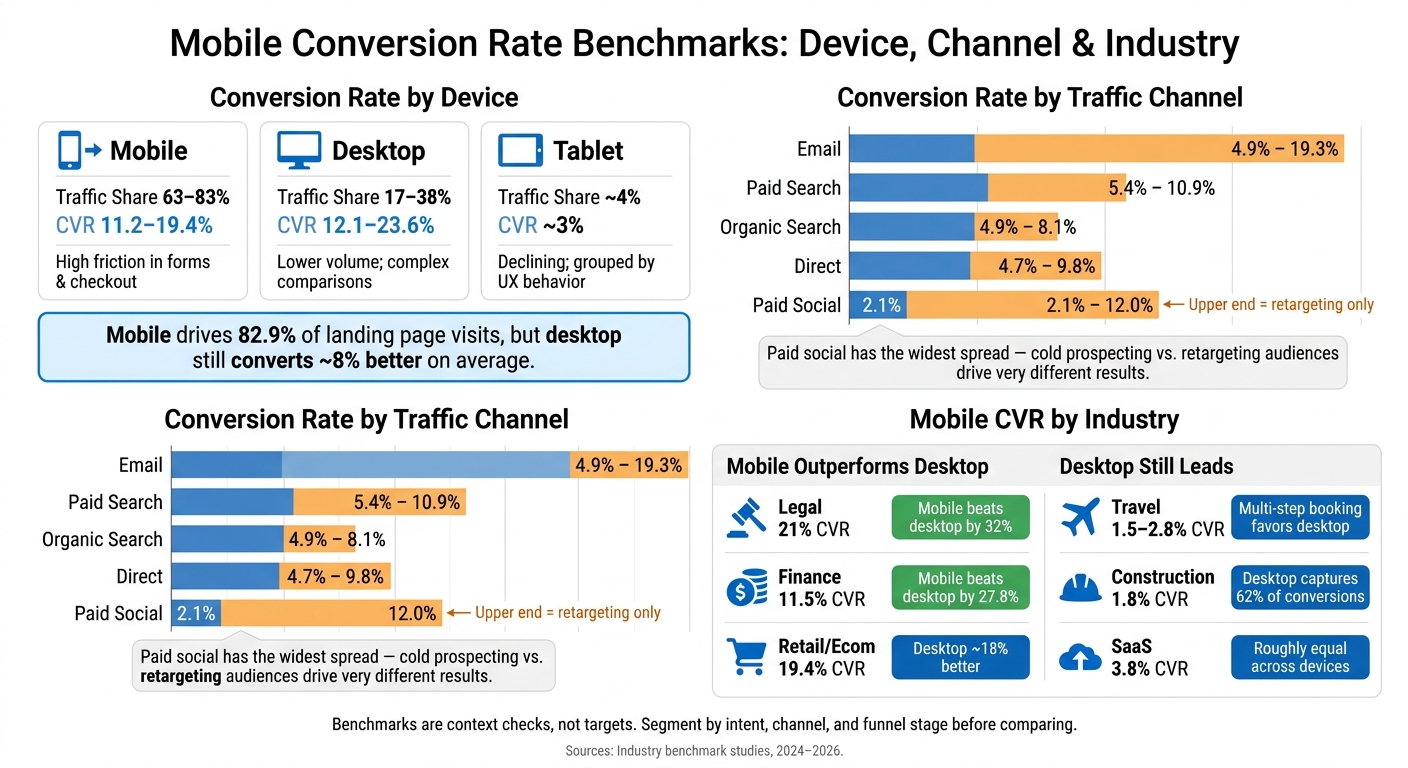
Mobile Conversion Rate Benchmarks: Device, Channel & Industry at a Glance
Device-Level Benchmarks: Mobile vs. Desktop vs. Tablet
The device split shows where mobile friction hits hardest.
Mobile drives 82.9% of landing-page visits, but desktop still converts a bit better on average - 12.1% vs. 11.2%. In most cases, that gap comes down to checkout friction, payment steps, and longer forms that feel easier to finish on a larger screen.
That said, device averages can hide a lot. In high-urgency sectors like legal and finance, mobile can beat desktop. Mobile converts 32% better than desktop in legal and 27.8% better in finance. When people need to act fast, they often do it on the phone already in their hand.
Tablet is a small slice at ~4% of traffic. Teams often group it with mobile or desktop based on how the UX behaves.
| Device | Traffic Share | Typical Conversion Rate | Key Constraint |
|---|---|---|---|
| Mobile | 63.38% - 82.9% | 11.2% - 19.4% | High friction in forms and checkout; speed sensitivity |
| Desktop | 17.1% - 38% | 12.1% - 23.6% | Lower volume; used for complex, multi-tab comparisons |
| Tablet | ~4% | ~3% | Declining share; often grouped with mobile or desktop behavior |
Device data helps, but it doesn't tell the whole story. Channel intent changes the benchmark again.
Channel-Level Benchmarks: Paid Search, Paid Social, Email, Organic, and Direct
Email leads the group at 19.3%. That's what you'd expect from a warmer audience with prior intent. Paid search comes next at 10.9%, while organic search and direct traffic sit lower at 4.9% and 4.7%.
Paid social has the biggest spread by far - 2.1% to 12.0%. Why such a wide gap? Because "paid social" can mean two very different things: cold prospecting or retargeting. The top end usually comes from retargeting or other warm-audience setups. If you use one blended paid social average, the comparison can get messy fast.
| Channel | Typical CVR Range | Common Constraints |
|---|---|---|
| 4.9% - 19.3% | List hygiene; mobile rendering; frequency fatigue | |
| Paid Search | 5.4% - 10.9% | High CPC; requires tight keyword-to-headline alignment |
| Paid Social | 2.1% - 12.0% | Discovery intent; better for retargeting |
| Organic Search | 4.9% - 8.1% | AI search summaries reducing click-throughs to site |
| Direct | 4.7% - 9.8% | Measurement gaps; "dark social" attribution issues |
Paid Search vs. Paid Social on Mobile: Key Differences
The clearest contrast on mobile is paid search versus paid social.
Paid search captures active demand. Someone is looking for an answer, product, or service right now. Paid social works differently - it interrupts attention in-feed. Because of that, mobile CVR tends to be lower unless you're serving ads to people who already know you.
Paid search on mobile averages 5.4% to 10.9%. Paid social runs 2.1% to 12.0%, but that upper end is driven mostly by retargeting.
| Metric | Paid Search (Mobile) | Paid Social (Mobile) |
|---|---|---|
| Intent Model | Active demand (pull) | Discovery / awareness (push) |
| Typical Mobile CVR | 5.4% - 10.9% | 2.1% - 12.0% |
| Main levers | Keyword-to-headline alignment; landing page relevance | Creative refresh cycles; retargeting; video engagement |
sbb-itb-89b8f36
Mobile Benchmarks by Industry and Funnel Stage
Industry Ranges: Retail, Travel, Finance, SaaS, and Lead Generation
Industry has a big effect on mobile benchmarks. Even when the device and channel stay the same, the vertical tightens the range.
Here’s where mobile conversion rates usually land by industry, how they stack up against desktop, and where things tend to break:
| Industry | Typical Mobile CVR | Mobile vs. Desktop | Main Friction Points |
|---|---|---|---|
| Retail / Ecommerce | 19.4% (landing page) | Desktop converts about 18% better than mobile | Unexpected shipping and tax costs; slow checkout load |
| SaaS | 3.8% | Roughly equal to mobile | Complex copy; long demo funnels |
| Finance | 11.5% | Mobile outperforms desktop | High-intent forms |
| Legal | 21% | Mobile outperforms desktop | Click-to-call; fast follow-up |
| Travel | 1.5% - 2.8% | Desktop usually wins for booking workflows | High-value, multi-step booking; multi-session research journeys |
| Construction | 1.8% | Desktop captures 62% of conversions | Bulk order complexity; technical spec reviews on mobile |
A clear pattern shows up here. Finance and legal tend to do well on mobile, while travel and construction still lean desktop-first. That makes sense. Some actions are simple on a phone - calling a law firm, filling out a short finance form. Others are harder - comparing travel options, reviewing specs, or placing a large order.
And there’s another layer to this: even inside the same industry, mobile CVR can shift a lot based on funnel stage.
Funnel Benchmarks: Landing Page, Add to Cart, Checkout Start, and Purchase
A sitewide mobile CVR can hide what’s actually happening. It blends strong top-of-funnel traffic with weaker bottom-of-funnel performance.
Mobile drives 82.9% of landing page visits. That sounds strong, but the drop-off starts fast once friction shows up. 53% of mobile visitors abandon pages that take longer than three seconds to load. On top of that, each extra second of load time cuts conversions by about 7%.
So the first filter is page speed. If the page loads slowly, a big chunk of visitors never even gets a chance to convert.
After that, checkout becomes the next choke point. Cart abandonment is one of the biggest loss areas in the funnel. The global average is 70.22% in 2026. On mobile sites that take more than five seconds to load, abandonment can hit 97%. That’s brutal. And in many cases, the reason is simple: shipping and tax costs show up too late.
Lead-gen funnels work a bit differently from ecommerce, so the conversion definition has to change too. For lead gen, form fills only tell part of the story. Call tracking matters - especially on mobile, where people often want to tap and talk instead of type.
In legal and professional services, 56.3% of conversions happen by phone. If you only track forms in your analytics, you’re undercounting mobile performance and missing a large share of mobile-driven leads.
How to Read Benchmark Gaps Without Making Bad Decisions
Benchmarks only help when you're comparing like with like.
Segment by Intent, Audience Warmth, and Traffic Quality
Don't judge mobile CVR until you split traffic by intent. Branded search, retargeting, and direct visitors already know you. They're much closer to taking action. Cold prospecting traffic is different - those people are often seeing you for the first time. If you mash all of that into one CVR and stack it up against an industry average, the result is often misleading.
The table below shows how intent changes expected mobile conversion behavior across common traffic sources:
| Traffic Source | Intent Level | Audience Familiarity | Typical CVR Pattern |
|---|---|---|---|
| Branded Search | Very High | High (existing awareness) | Highest CVR; often 2–3x higher than non-brand |
| Non-Branded Paid Search | High | Low to Medium | Strong conversion (avg. 5.4%); driven by immediate need |
| Retargeting Social | Medium | High (previous visitors) | High CVR; often 3x better return than cold social |
| Cold Social | Low | Low (prospecting) | Lowest CVR (avg. 2.11%); primarily top-of-funnel awareness |
| High | Very High (owned list) | Highest CVR on owned traffic |
Even inside one company, basic segmentation - brand vs. non-brand, new vs. returning, mobile vs. desktop - can change conversion performance by 2x to 3x. So a gap that looks bad in blended reporting can vanish once you break the data apart by intent. That's the first filter to use before you judge any benchmark gap.
Avoid Blended Averages and Mismatched Definitions
Another easy mistake is comparing numbers that don't mean the same thing. A visitor-to-lead rate and a lead-to-meeting rate are both called conversion rates, but they track different stages. The denominator is different. The funnel stage is different. If you compare them as if they're the same, you're going to get the wrong read.
Paid search captures active demand. Paid social is more about discovery. So if you want a fair comparison, segment for intent and retargeting first.
Build a 90-Day Internal Baseline Before Acting
Once you've segmented by intent, build your own baseline before you move budget. Before shifting spend, build a 90-day segmented baseline. Track performance by device, channel, landing page, and funnel stage, and do it the same way for at least 90 days. That gives you a clean read on whether mobile results are above or below the right benchmark slice.
Set one primary mobile conversion, like a purchase or qualified lead, plus two secondary indicators, like add-to-cart rate and form completion rate. That way, you can see where the funnel breaks instead of guessing.
Also, audit mobile tracking using top PPC tools. Make sure click-to-call events and form submissions are being recorded the right way. Mobile tracking gaps are common.
Conclusion: What Teams Should Take from Mobile Conversion Benchmarks
The main takeaway is simple: mobile benchmarks are context checks, not targets. What counts as "good" changes based on your industry, traffic source, sales cycle, and product value.
Treat paid search and paid social as separate benchmarks because user intent is different. If you use one CVR target for both, you can end up making bad budget calls.
The same idea applies across the funnel. Benchmark averages give you context, but they are not the number to chase. The real job is to find where the funnel breaks - the landing page, cart, or checkout - and fix that stage before you change spend or UX.
For teams that need tools and partners to act on these findings, teams focused on ROI and CAC efficiency can use the Top PPC Marketing Directory for PPC tools and agencies tied to pipeline and payback.
FAQs
Why does desktop often convert better than mobile?
Desktop often converts better than mobile because mobile users run into more friction - especially during checkout and payment. Data shows desktop conversion rates are about 8% higher.
Mobile may bring in most landing page visits, but smaller screens can make it harder for people to finish a purchase. There’s less room, more tapping, and more chances to drop off.
That gap can shrink with a few smart fixes: mobile-first design, faster load times, simpler checkout, and thumb-friendly calls to action.
How should I benchmark mobile CVR by channel?
Benchmark mobile CVR by channel within your industry and device segment - not against broad cross-industry averages. Mobile often trails desktop by 25% to 40%, but that gap also reflects user intent and site experience.
When you compare channels, start with intent. Paid search usually converts better than display or social because it picks up active demand. So a lower mobile CVR isn't always a red flag by itself.
Use median and quartile ranges for context. And if mobile CVR looks low, check for landing page friction first - slow load times, clunky forms, weak message match, or a rough checkout flow can drag performance down fast.
What should I include in a 90-day mobile baseline?
Look at granular data, not broad averages. Break conversion rates down by channel, device, and funnel stage so you can see exactly where performance slips - especially where mobile users drop off.
Use median performance as your baseline, and compare it with your top 25% performers. Stick to recent data so you’re judging what’s happening now, not what happened months ago. And don’t look at CPC in isolation - pair it with engagement signals and profit metrics like ROAS to get the full picture.
It also helps to clean up data quality problems before you act on anything. That includes fixing UTMs and setting up phone call tracking where it matters.