PPC reporting can feel overwhelming with data scattered across platforms like Google Ads, Facebook Ads, and Microsoft Advertising. The key to success? Consolidating this data into clear, actionable insights. This guide breaks down how to simplify PPC reporting using analytics tools, covering everything from integrating platforms to building dashboards and tracking the metrics that matter most.
Key Takeaways:
- Why It Matters: PPC reporting helps identify which campaigns truly drive results, not just clicks.
- Simplify with Tools: Use analytics tools to unify data from multiple platforms into one dashboard.
- Metrics to Track: Focus on ROAS, CPC, CPA, and conversion rates instead of vanity metrics.
- Data Prep: Ensure clean data with consistent UTM tags, currency normalization, and time zone alignment.
- Dashboards: Design user-friendly dashboards with clear visuals for daily and long-term insights.
- Advanced Techniques: Multi-touch attribution and CRM integration provide deeper insights into customer journeys.
Build the Ultimate PPC Report in Google Data Studio
PPC Reporting Basics with Analytics Tools
Before diving into detailed dashboards or advanced attribution models, it’s important to understand the basics of PPC reporting. Think of your reporting system as a connected framework where every part plays a specific role. These fundamental elements bridge the gap between collecting raw data and creating the sophisticated dashboards we’ll explore later.
Core Components of a PPC Reporting Stack
A complete PPC reporting setup includes five key layers that work together to turn raw advertising data into meaningful insights.
- Ad platforms like Google Ads, Microsoft Advertising, and Meta Ads are your starting point. These platforms capture crucial data like spend, clicks, impressions, and platform-specific conversions. This is the foundation of your reporting.
- Analytics platforms such as GA4 provide insights into what happens after the click. While ad platforms show you the initial interaction, analytics platforms reveal user behavior - like which pages they visited, how long they stayed, and whether they completed actions like purchases or form submissions.
- Data connectors and ETL tools help unify scattered data sources. Tools like Supermetrics automate the process of pulling data from multiple platforms, standardizing naming conventions, and normalizing currencies. This eliminates the manual work of downloading CSV files and reconciling differences across platforms.
- The visualization layer transforms cleaned data into easy-to-read dashboards. Tools like Looker Studio allow you to analyze data from hundreds of sources, creating interactive dashboards that stakeholders can use to make informed decisions.
- Finally, a governance framework ensures the consistency and quality of your data over time. This includes standardized UTM tagging, currency normalization, time zone alignment, and access controls. Without these measures, even the most advanced setup can produce unreliable results.
For example, Supermetrics can extract data from platforms like Google Ads, Meta, and Shopify, load it into BigQuery for currency conversions and standardization, and then send it to Looker Studio for visualization. GA4 adds event-based conversion data, mapped to campaigns using UTM parameters, creating a seamless flow of actionable insights for dashboards and attribution models.
Important PPC Metrics to Track
Not all metrics are equally useful. Focus on those that drive decisions and impact business results, rather than vanity metrics that look good but don’t provide value.
- Awareness and reach metrics: Impressions and CPM help you understand how visible and cost-efficient your campaigns are at the top of the funnel.
- Engagement metrics: Click-through rate (CTR) measures how compelling your ads are. A low CTR suggests you may need to tweak your ad copy, targeting, or offer.
- Cost efficiency metrics: Metrics like cost-per-click (CPC) and cost-per-acquisition (CPA) directly affect how you allocate your budget.
- Conversion performance metrics: These include conversion rate, revenue, and return on ad spend (ROAS) - critical for evaluating whether your campaigns are driving meaningful results.
- Customer value metrics: Lifetime value (LTV) helps guide long-term strategies. For instance, if your average order value is $120 and your target ROAS is 400%, your allowable CPA would be roughly $30, assuming a 25% conversion rate from add-to-cart to purchase.
GA4’s event-based tracking adds depth by capturing detailed post-click actions like add_to_cart, begin_checkout, and purchase. This allows you to identify where users drop off in the funnel and prioritize high-value audiences for better bidding and budget allocation.
Data Preparation for Accurate Reporting
Clean data is the bedrock of reliable PPC reporting. Investing time in preparation upfront can save countless hours of troubleshooting later.
- UTM governance: A clear and consistent UTM tagging scheme is critical for accurate attribution. Use a shared UTM builder tool, validate all links before campaigns go live, and regularly audit GA4 traffic acquisition reports to correct any inconsistencies.
- Currency normalization: When running campaigns across platforms or regions, convert all monetary values to USD using a consistent exchange rate. Display amounts in proper US formatting, such as $1,234.50.
- Time zone alignment: Ensure all data extraction and dashboards use your primary US time zone to avoid discrepancies. Matching time zones across platforms and using MM/DD/YYYY date formatting can prevent reporting errors.
- Conversion tracking setup: Properly configure GA4 events to capture the actions that matter most to your business. For example, retail businesses should set up enhanced ecommerce tracking, while B2B companies might focus on lead events. Always test your tracking thoroughly before launching campaigns - small errors can disrupt weeks of data collection.
For additional resources, the Top PPC Marketing Directory offers a curated list of tools and services to enhance your reporting stack. From campaign management platforms to specialized data integration tools, these solutions can help you build a reporting system tailored to your needs. Once your data is clean and aligned, you’ll be ready to integrate insights into dynamic, cross-platform dashboards.
Setting Up Analytics Integrations for PPC
Getting your PPC data properly integrated is crucial for accurate and dependable reporting. The connections between your ad platforms and analytics tools can unlock valuable insights - or cause issues if not set up correctly.
Configuring Google Analytics 4 (GA4) for PPC
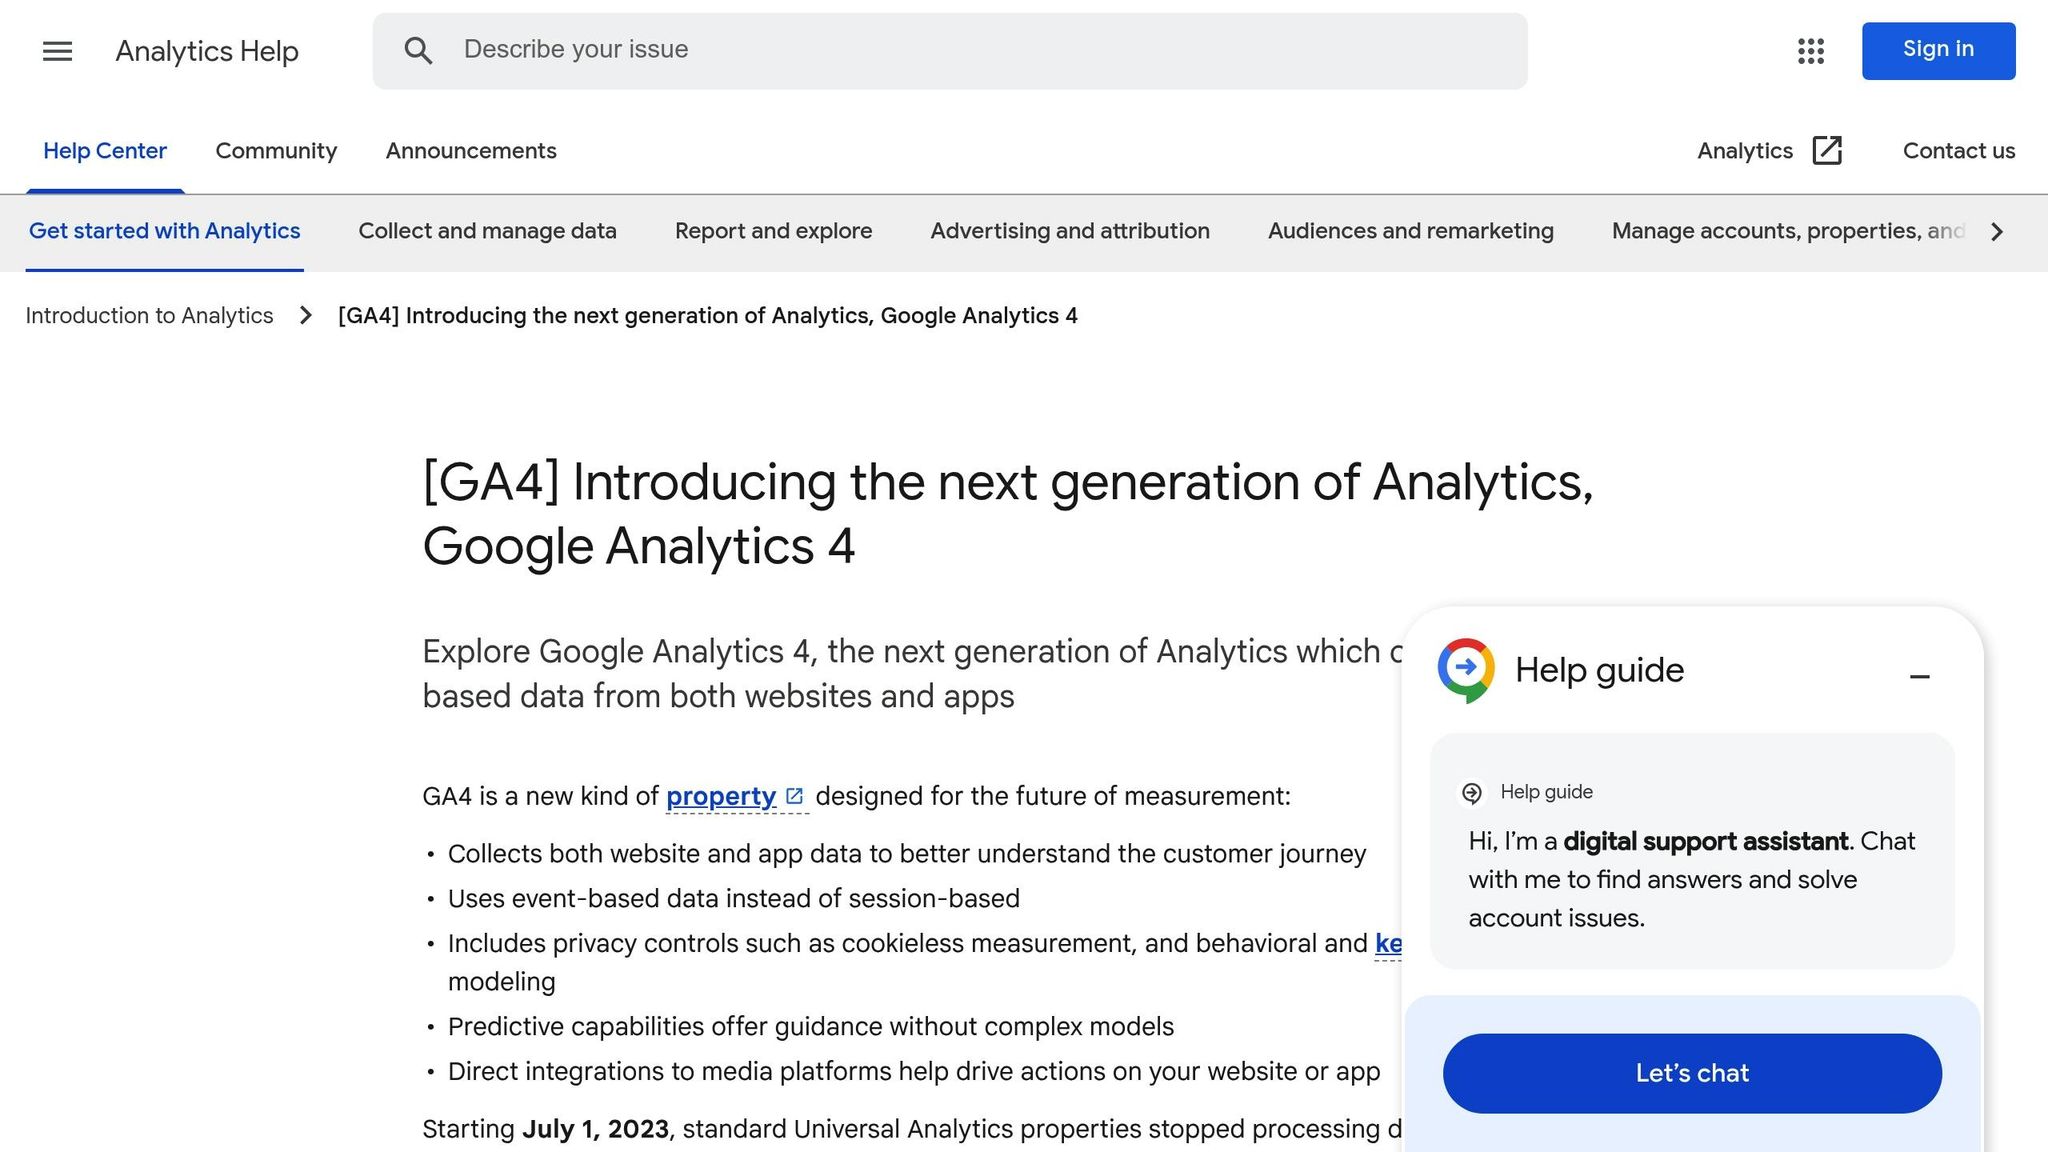
GA4's event-based tracking provides powerful tools to analyze PPC performance when configured properly.
Linking Google Ads to GA4
To enable cross-platform reporting, link Google Ads to GA4. Go to Admin > Product Links > Google Ads Links in your GA4 property and connect your Google Ads account. This setup allows automatic cost data imports and creates audiences that can be shared back to Google Ads for remarketing. Make sure auto-tagging is enabled in Google Ads and import all available metrics like cost, clicks, and impressions.
Enhanced conversions can improve attribution accuracy by sending hashed customer data back to Google Ads. This feature helps recover conversions lost due to cookie restrictions or cross-device behavior. Enable enhanced conversions for web in both GA4 and Google Ads, ensuring your website securely passes customer information, such as email addresses or phone numbers, in a privacy-compliant way.
Event configuration is key to measuring and optimizing PPC actions. While GA4 automatically collects some events, you may need to set up custom ones for PPC-specific actions. For example, create events for stages like "view_item", "add_to_cart", "begin_checkout", and "purchase." Add parameters like item_id, currency, and value for deeper analysis.
Marking conversions helps you focus on the events that align with your business goals. In GA4, go to Configure > Events and mark your most important events as conversions. These conversions typically sync to Google Ads within 24–48 hours, making them available for automated bidding strategies.
Attribution model selection determines how credit is assigned to different touchpoints. GA4 uses data-driven attribution by default, which applies machine learning to allocate conversion credit based on user behavior patterns. This approach often provides better insights for PPC campaigns compared to last-click attribution, especially for longer sales cycles or multi-channel journeys.
Getting GA4 set up correctly ensures a strong foundation for integrating multiple data sources and creating unified dashboards.
Connecting Multiple Data Sources
Modern PPC campaigns often rely on data from various platforms, and manually collecting this information can quickly become overwhelming. Automated connectors simplify the process by aggregating data into one location.
Free connectors like GA4's built-in integrations and Looker Studio's native connectors are great for basic reporting. Looker Studio can connect directly to platforms like Google Ads, GA4, and Google Sheets without additional costs. However, these free tools may have limits on data freshness, historical data availability, and customization.
Paid connector solutions such as Supermetrics offer more advanced features for complex reporting needs. Supermetrics can pull data from over 60 platforms - including Google Ads, Microsoft Advertising, Meta Ads, LinkedIn Ads, TikTok Ads, and Amazon Advertising - and standardize key elements like currency and time zones.
Data warehouse integration is ideal for advanced reporting scenarios. Tools like Supermetrics can send data to warehouses like BigQuery or Snowflake, allowing you to combine PPC data with CRM, sales, or customer service data. This setup supports advanced analyses like customer lifetime value and detailed attribution modeling.
API connections provide the most flexibility but require technical expertise. Platforms like Google Ads, Microsoft Advertising, and Meta offer APIs for direct data extraction. These APIs allow you to build custom integrations tailored to your specific reporting needs.
When choosing a connector, consider factors like data refresh frequency, historical data limits, cost, and technical support. Many businesses begin with free tools and upgrade to paid solutions as their needs evolve.
After integrating your data, it's essential to ensure its accuracy and compliance.
Data Quality and Compliance
Once your data is aggregated, validating its accuracy is critical. Clean, reliable data is the backbone of effective PPC reporting. Errors can lead to poor optimization decisions and wasted ad spend.
Validation procedures should regularly check for discrepancies. Compare metrics like spend, clicks, and conversions between your source platforms and reporting dashboards. Set up automated alerts for significant discrepancies, such as a 20% difference in conversions between GA4 and Google Ads. Common causes include time zone mismatches, different conversion windows, and attribution model variations.
Sampling limitations can affect data in high-traffic accounts. Sampling occurs when large datasets are processed, potentially reducing accuracy. Watch for sampling indicators in your reports and consider using GA4's BigQuery export for unsampled data if you’re working with extensive datasets.
Privacy compliance with regulations like GDPR and CCPA is mandatory. Use GA4's consent mode to adjust tracking based on user consent while still gathering actionable insights. Ensure your tracking setup aligns with data retention policies and user preferences.
Cross-domain tracking is crucial for businesses with multiple domains or subdomains. Configure GA4's cross-domain measurement to maintain user sessions across different domains. This ensures accurate attribution for multi-step conversion processes, especially for e-commerce sites that redirect to third-party payment platforms.
Data retention settings in GA4 allow you to control how long user-level data is stored. For example, you can retain detailed data for up to 14 months. Align these settings with your privacy policy and local regulations.
Regularly review your tracking setup, UTM parameters, and conversion definitions to maintain accuracy. Document any changes to streamline troubleshooting.
For vetted analytics tools, visit the Top PPC Marketing Directory to simplify your setup process.
Building Cross-Platform PPC Dashboards
Turning raw data into meaningful insights is the cornerstone of effective PPC campaign management. Cross-platform dashboards play a critical role in this process, consolidating metrics from various advertising platforms into one cohesive view. When designed thoughtfully, these dashboards can empower teams to make smarter, faster decisions.
Dashboard Design Best Practices
A successful PPC dashboard starts with a clear structure and intuitive visual design. Place the most important metrics - like total spend, return on ad spend (ROAS), and conversion volume - at the very top. These high-level KPIs should stand out with bold, easy-to-read visualizations.
Organize the dashboard to reflect the frequency of decision-making. Metrics used for daily optimizations, such as cost-per-click (CPC), click-through rate (CTR), and conversion rate, should appear higher up. Metrics that guide long-term strategy - like customer acquisition cost (CAC) and lifetime value (LTV) - can be positioned lower.
To simplify analysis, use consistent color schemes to represent different platforms. For example, assign a unique color to each data source so users can quickly identify where the data is coming from. This approach reduces mental effort and makes it easier to compare performance across platforms.
Add budget pacing tools to help manage spending. Visual indicators, like color-coded bars or progress trackers, can show whether campaigns are on budget, slightly off, or significantly over or under their targets.
Highlight conversion efficiency by focusing on the best-performing campaigns and ad groups. Use bar charts or other comparative visuals to showcase metrics like conversion rate, cost per acquisition (CPA), and ROAS across campaigns or platforms.
Incorporate audience insights into the dashboard. Panels showing demographic breakdowns, device performance, or geographic data can uncover optimization opportunities and guide budget allocation decisions.
Finally, ensure the dashboard is visually clean and easy to navigate. Logical grouping, consistent fonts, and sufficient spacing are key to maintaining clarity and usability.
Direct Integration vs. Data Warehousing
How you integrate data into your dashboard is just as important as the design itself. Two primary methods are direct integration and data warehousing, each with its own strengths.
Direct integration connects your dashboard directly to advertising platforms, allowing for quick setup and near-real-time updates. However, this method may limit your ability to analyze historical trends or perform complex calculations.
Data warehousing, on the other hand, gathers data from multiple platforms into a centralized repository. While setting up a data warehouse requires more time and technical expertise, it offers greater flexibility. You can create custom metrics, analyze long-term trends, and even combine PPC data with other business information. This method is ideal for teams that need deeper insights and advanced analytics.
Once your data is integrated, automating the reporting process ensures your dashboard stays up-to-date and actionable.
Automating Reports and Distribution
Automation takes the hassle out of manual reporting, saving time and ensuring timely updates.
Schedule data refreshes to align with your workflow. For operational metrics, refresh data during working hours. For strategic summaries, overnight updates can provide fresh insights for the next day.
Set up alerts for critical KPIs. For instance, configure notifications to flag unexpected changes in spend or conversions. Alerts delivered through email or collaboration tools can help your team address issues before they escalate.
Customize report distribution for different audiences. Operational teams often need detailed, frequent reports, while executives prefer concise summaries that highlight key trends and overall performance.
Use features like conditional formatting and timestamps to make reports clearer. For example, highlight significant changes in performance or include reporting periods to avoid confusion when comparing data. Also, implement failure notifications to catch issues like missed data refreshes or broken API connections quickly.
For advanced automation tailored to PPC reporting, explore tools listed in the Top PPC Marketing Directory. These specialized tools can streamline your dashboard setup and reporting processes, enabling more efficient and data-driven decision-making across your campaigns.
Choosing the Right Analytics Tools for PPC Reporting
Picking the right analytics tool can make or break your PPC reporting strategy. With so many tools offering different features and pricing options, it’s important to align your choice with your specific needs and budget.
Key Criteria for Tool Selection
When evaluating tools for PPC reporting, keep these factors in mind:
- Data integration: Opt for tools that seamlessly connect with major ad platforms like Google Ads, Microsoft Ads, Facebook Ads, and LinkedIn Ads through APIs for real-time updates.
- Customization options: Look for solutions that allow you to create intuitive dashboards or offer advanced customization capabilities, such as SQL queries or custom fields.
- Data retention policies: If analyzing long-term trends or year-over-year performance is important, prioritize tools with extended data retention options.
- User access management: Ensure the tool supports role-based permissions to control team access effectively.
- Customer support: Responsive support can be a lifesaver when technical issues arise during critical business hours.
- Transparent pricing: Be clear on the total cost, including any setup fees or usage-based charges, to avoid surprises.
These considerations will help you narrow down your options and find the tool that best fits your reporting needs.
Popular Reporting Tools Overview
Here’s a quick look at some widely-used PPC reporting tools that align with these criteria:
- AgencyAnalytics: Perfect for agencies, this tool offers white-label reporting and customizable dashboards.
- Looker Studio: A free platform with native integration into Google products and support for various data sources.
- Whatagraph: Simplifies reporting with presentation-ready templates and automated report generation.
- Supermetrics: Acts as a data pipeline, moving data from ad platforms into your preferred reporting tool.
Each tool has its own strengths, so your choice will depend on whether you need an agency-focused platform or a versatile tool that fits into your existing workflow.
Using the Top PPC Marketing Directory
The Top PPC Marketing Directory can be a valuable resource. It categorizes analytics tools, expert agencies, and PPC services into clear sections like performance tracking, campaign management, and A/B testing. This makes it easier to evaluate vendors and choose the right solutions for your data-driven campaigns.
sbb-itb-89b8f36
Advanced PPC Measurement and Attribution Techniques
To truly understand the impact of your campaigns, you need to go beyond basic reporting. Advanced measurement techniques provide deeper insights into the customer journey, enabling smarter decisions about where to allocate your budget and how to refine your targeting.
Multi-Touch Attribution Models
Multi-touch attribution models offer a more complete picture of campaign performance by distributing credit across all touchpoints in the customer journey. Unlike last-click attribution, which only credits the final interaction, these models provide a balanced perspective:
- First-click attribution highlights the initial interaction.
- Linear attribution splits credit evenly across all touchpoints.
- Time-decay attribution gives more weight to recent interactions.
- Data-driven models rely on machine learning to assign credit based on observed patterns.
By adopting multi-touch attribution, you can better understand how different interactions contribute to conversions. Combine this with CRM data for even more refined insights into performance.
Integrating CRM and Revenue Data
Integrating CRM data with your campaign metrics allows you to track more than just initial conversions - it helps you assess lead quality and customer lifetime value. Through CRM APIs, you can connect closed-loop revenue data to your reporting tools, creating a seamless feedback loop that tracks the journey from the first click to the final sale.
This integration also enables cohort analysis, helping you monitor how customer value changes over time. It’s a powerful way to compare metrics like cost-per-lead versus cost-per-customer, giving you a clearer sense of your campaign’s efficiency and long-term impact.
Predictive Metrics and Budget Pacing
Predictive analytics takes your reporting to the next level by forecasting future behaviors and campaign outcomes. For instance, Google Analytics 4 offers predictive metrics such as:
- Users likely to purchase in the next 7 days
- Users likely to churn in the next 7 days
To use these metrics, you’ll need at least 1,000 users who completed the event and 1,000 who didn’t within a rolling 7-day window over the past 28 days. These predictions update every 24 hours, providing fresh insights.
Targeting predictive audiences can maximize your budget’s effectiveness. For example, you can focus on users with a high likelihood of purchasing while excluding those likely to churn. This approach has been shown to improve campaign incrementality by 40-60%.
Additionally, tools like marginal ROAS analysis and audience saturation scoring can help you fine-tune your budget pacing:
- A saturation score under 50 indicates room to scale.
- Scores between 50 and 100 suggest testing expanded targeting.
- A score over 100 signals the need to broaden your audience or adjust your strategy.
Integrate these predictive insights into your budget pacing dashboards alongside real-time spend data. This proactive approach can help you avoid overspending while keeping your campaigns on track.
Finally, test predictive segments individually, and once you identify successful strategies, scale them for greater impact.
Managing and Maintaining PPC Dashboards
Maintaining data accuracy is just as important as creating a solid PPC reporting system. The long-term success of your dashboards depends on ensuring they remain accurate, reliable, and practical through proper upkeep and management.
Creating a Single Source of Truth
To keep your dashboards dependable, you need a single source of truth. This involves building on solid data preparation practices and documenting everything clearly. Start with a data dictionary that explains each metric’s source, how it's calculated, and whether it tracks unique or total values. Include details on attribution models, filters, and data refresh schedules. Standardizing campaign names, ad groups, and tracking parameters also helps avoid confusion.
Setting a hierarchy for metrics can streamline focus. Define primary and secondary KPIs for different roles - executives, campaign managers, and other team members - so they can zero in on the metrics that matter most to them. This approach reduces unnecessary information overload and keeps dashboards clean and purposeful.
QA and Validation Best Practices
Regular quality assurance (QA) is key to spotting issues before they escalate. Schedule periodic validation checks and set up automated alerts to compare dashboard data with native reports, flagging any unusual trends or discrepancies.
Cross-platform reconciliation is another vital step. For example, compare total spend and conversion counts across your tools to ensure consistency. While slight differences may occur due to attribution models, major mismatches should raise red flags.
Create a validation checklist to address common issues, such as:
- Verifying tracking parameters in campaign URLs
- Ensuring conversion tracking codes are firing correctly
- Checking that audience segments are populating as expected
These checks are especially important when launching new campaigns or updating tracking systems. Regular validation ensures your data stays consistent and reliable.
Version Control and User Access
Managing dashboards effectively also requires strict version control and user access protocols. Keep an audit trail with timestamps for all changes, roll out updates in a controlled staging environment, and follow a "least privilege" principle - only grant editing rights to those who truly need them.
Provide training materials to help users understand the dashboard. Include instructions on filtering data, adjusting date ranges, and drilling down into campaign details. This minimizes errors caused by misunderstandings and ensures the dashboard is used correctly.
To maintain control, save version histories, export key configurations, and use approval workflows for updates. This ensures changes align with business goals and can be rolled back if needed.
Lastly, monitor performance regularly. As data grows, dashboards can slow down. Periodically check load times and optimize queries or data structures to keep everything running smoothly.
Key Takeaways for PPC Reporting
Turning raw campaign data into meaningful insights is the essence of PPC reporting. It all starts with clear metrics, the right tools, and accurate data as the foundation.
Summary of Best Practices
To build an effective PPC reporting system, start by preparing your data properly. Clean and standardized data ensures your dashboards stay accurate and reliable. Focus on tracking metrics that align with your business goals instead of getting bogged down by every available data point.
Integration plays a key role in creating a comprehensive view of your campaigns. Connect platforms like Google Analytics 4, CRM systems, and other data sources to unify performance insights. This cross-platform approach uncovers trends that individual tools might miss.
When designing dashboards, prioritize clarity and tailor views to your audience. Executives, campaign managers, and analysts all have different needs, so customize their dashboards accordingly. Automated reporting can save time and ensure stakeholders receive consistent updates without manual effort.
Maintaining data quality requires ongoing effort. Regular validation checks, cross-platform comparisons, and automated alerts can help you catch errors before they lead to poor decisions. Documenting processes and maintaining version control ensures consistency across your team.
As customer journeys become more complex, attribution modeling becomes essential. Multi-touch attribution offers a clearer picture of how various touchpoints contribute to conversions, helping you allocate budgets more effectively across channels and campaigns.
These practices lay the groundwork for selecting the right tools to enhance your reporting system.
Final Thoughts on Tool Selection
When choosing analytics tools, consider your organization's needs, budget, and technical expertise. Think about factors like data volume, integration capabilities, and your team's skill set. A tool that's perfect for one company might not be the right fit for another.
Look for tools that meet your current needs but can also scale as your PPC efforts grow. Simplicity is key - opt for solutions that make reporting straightforward while accommodating additional data sources as your campaigns expand.
To streamline the selection process, the Top PPC Marketing Directory offers vetted recommendations tailored to your industry and business size.
Finally, invest in training your team to get the most out of your reporting setup. The goal is actionable insights that drive improvements, not just flashy dashboards. By focusing on these fundamentals, you’ll create a reporting system that delivers real value and measurable results.
FAQs
How can I ensure my PPC data is accurate and complies with privacy regulations?
To keep your PPC data both reliable and compliant with privacy standards, prioritize privacy-focused tracking methods like Consent Mode. This approach ensures data collection aligns with user consent. Make sure your practices adhere to privacy laws such as GDPR and CCPA, which emphasize transparency and ethical data handling. If you're operating in the U.S., remember that privacy regulations can vary by state, as there's no overarching federal law on data privacy.
It's also important to regularly update your privacy policies to stay aligned with the latest legal requirements. On top of that, verify that your ad content is honest and follows advertising guidelines. Taking these precautions helps you protect data accuracy while staying on the right side of the law.
What are the advantages of using multi-touch attribution models in PPC reporting, and how are they different from traditional models?
Multi-touch attribution models provide a broader perspective on the customer journey by assigning credit to multiple interactions that lead to a conversion. This allows marketers to identify which channels and tactics are performing well, helping them allocate budgets wisely and refine their campaign strategies for better outcomes.
Traditional attribution models often focus solely on the first or last interaction, but multi-touch models take a different approach. They spread credit across various touchpoints, offering clearer insights into how each part of your PPC strategy plays a role in driving results. This makes it easier to make informed, data-backed decisions.
How can I select the best analytics tools for PPC reporting while staying within my budget and considering my team’s technical skills?
Picking the Best Analytics Tools for PPC Reporting
When selecting analytics tools for PPC reporting, start by assessing two key factors: your budget and your team’s technical skill set. Opt for tools with flexible pricing options that can grow with your needs, and prioritize platforms with a straightforward, user-friendly design to accommodate team members with varying levels of expertise.
Key features to prioritize include real-time data tracking, cross-platform integration, and customizable reporting. These capabilities enable you to keep a close eye on performance, streamline data from multiple sources, and tailor reports to match your specific goals. Don't forget to check how seamlessly the tool integrates with your current systems - this can save a lot of time and hassle down the line. By aligning your choice with these considerations, you'll find a tool that works well within your budget and supports your team’s capabilities.