A/B testing for Pinterest's Story Pin Ads (now called Idea Ads) is a method to improve ad performance by testing different creative elements. With over 537 million monthly users and 85% of weekly users making purchases influenced by Pins, optimizing your ads can lead to better results.
Key takeaways:
- Idea Ads are multi-page, full-screen formats ideal for storytelling (up to 20 pages).
- A/B testing helps identify what works best, focusing on elements like the opening frame, visuals, and call-to-action (CTA).
- Set clear goals, like improving CTR, conversion rates, or ROAS.
- Use Pinterest Ads Manager to test one variable at a time for accurate results.
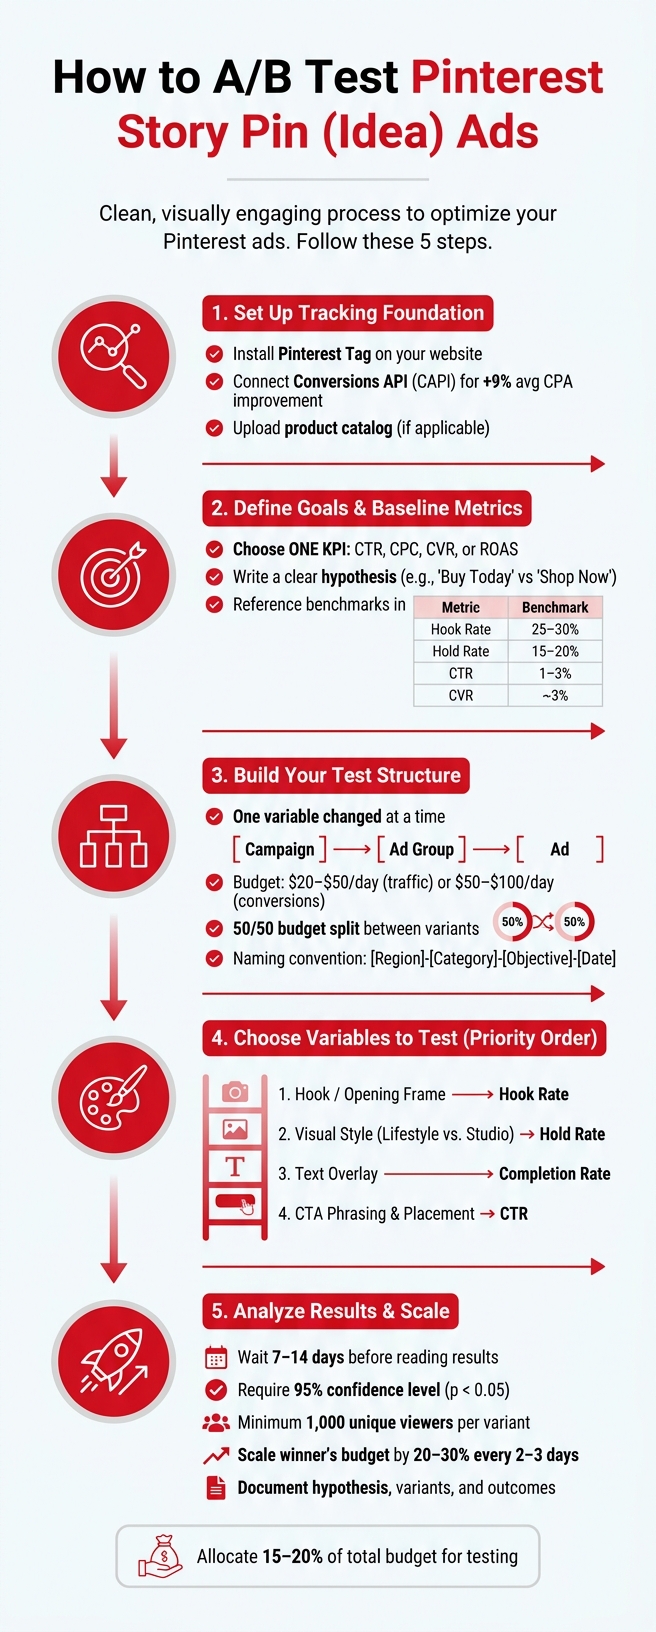
- Ensure proper tracking with the Pinterest Tag and Conversions API for better data accuracy.
Steps to start:
- Define your key performance metric (e.g., CTR, CPC).
- Establish a baseline using past data (e.g., CTR: 1–3%, CVR: ~3%).
- Test variables like hooks, visuals, text overlays, and CTAs using top PPC tools.
- Allocate equal budgets and ensure statistical validity (95% confidence level).
- Gradually scale successful ads while documenting results.
A/B Testing for Pinterest Story Pin Ads: Step-by-Step Process
The ONLY Pinterest Ads Testing Strategy You Need (€157k in 90 Days)
sbb-itb-89b8f36
Preparing for A/B Testing on Pinterest
Before diving into A/B testing, you need to set up a solid foundation. Without proper tracking, your results won’t mean much - they’ll just be noise.
Setting Up Your Pinterest Business Account
To get started, you’ll need a Pinterest Business account, which gives you access to Ads Manager and other PPC advertising tools. The key technical step here is installing the Pinterest Tag on your website. This tag helps track post-click actions like visits, sign-ups, and purchases.
For even better tracking, combine the Pinterest Tag with the Conversions API (CAPI). Advertisers who use both tools report a 9% improvement in average CPA compared to those relying solely on the tag. If your tag data isn’t strong, Pinterest’s optimization won’t work as effectively.
If you’re selling products, make sure to upload your catalog. This allows Pinterest to match your ads with your inventory seamlessly.
Once your tracking is set up, you’ll need to decide on the one key metric your test aims to improve.
Defining Your Testing Goals and Metrics
Every test needs a clear goal. Are you looking to reduce your Cost Per Click (CPC)? Boost your conversion rate? Or maybe increase your Return on Ad Spend (ROAS)? Choose one key performance indicator (KPI) to focus on and design your test around it.
Next, write a simple hypothesis. For example, you might hypothesize that changing a call-to-action from "Shop Now" to "Buy Today" could increase clicks.
Finally, compare your test results to your current performance to see if there’s an actual improvement.
Setting a Performance Baseline
Baseline data is critical - it shows whether the new version outperformed the original. Start by pulling data from past campaigns to identify your current averages for key metrics like Click-Through Rate (CTR), Cost Per Click (CPC), and conversion rate (CVR). If you’re running video Story Pins, also track Hook Rate (3-second views divided by impressions) and Hold Rate (15-second views divided by impressions).
Here are some starting benchmarks to guide you:
| Metric | Starting Benchmark |
|---|---|
| Hook Rate | 25–30% |
| Hold Rate | 15–20% |
| CTR | 1–3% |
| CVR | ~3% |
When setting your daily budget, aim for at least 5x your target CPA. This ensures Pinterest’s algorithm has enough data to optimize during the learning phase, which usually lasts about two weeks. To get clean results, avoid making changes to bids, audiences, or creatives during this period.
With your baseline in place, design your test to focus on just one variable at a time.
How to Set Up A/B Tests for Story Pin Ads
Building a Clean Campaign Structure for Testing
Once you've determined your KPI and baseline, the next step is to structure your test so that only one variable changes. This ensures your baseline becomes a reliable point of comparison.
Pinterest organizes campaigns into three levels: campaign, ad group, and ad. Stick to one objective per campaign - this prevents algorithm conflicts that could skew your results. For creative testing, include 2–4 ad variations within a single ad group. If you're testing targeting, create separate ad groups with the same creatives. This way, you can isolate the targeting variable, such as testing keywords against interests.
Consistency in naming conventions is crucial for staying organized. A format like [Region]-[Category]-[Objective]-[Date] works well, making it easier to track and compare results later.
Budget and Bidding Recommendations
To eliminate bias, allocate the same budget for both test variants. Unequal spending can distort results, making it unclear whether performance differences are due to the variable being tested or budget differences. Use ad group budgets (ABO) to ensure spending is split evenly, with a 50/50 distribution.
Pinterest has minimum daily budget requirements: $5 for awareness or traffic campaigns and $10 for conversion campaigns. However, these amounts are often too low for meaningful testing. Instead, aim for daily budgets of $20–$50 for traffic campaigns and $50–$100 for conversion campaigns. To optimize effectively, aim for at least 50 conversions per variant during the learning phase.
Here’s a quick look at bidding strategies:
| Bidding Strategy | Best For | Control Level |
|---|---|---|
| Automatic Bidding | New advertisers and broad discovery goals | Low |
| Custom Bidding (max CPC/CPM) | Advertisers with strict cost limits | High |
| Target Cost | Predictable CPA outcomes | Medium |
For most A/B tests, automatic bidding is a good starting point, especially for those new to Pinterest ads.
Running the A/B Test in Ads Manager
With your campaign structure and budget ready, start by creating a control ad group using your existing Story Pin creative. Then, duplicate the ad group and change only one variable, keeping all other elements the same. Popular variables to test include the headline, the opening frame, or the call-to-action (CTA).
Ensure both test variants use the same placements to avoid delivery bias. This prevents one variant from performing better simply because the algorithm favored a particular placement.
Before launching, double-check that your Pinterest Tag or Conversions API is functioning properly. After the campaign goes live, avoid making changes to bids, audiences, or creatives for at least 7–14 days.
Once everything is set up, focus on testing a single variable at a time to maintain clarity in your results.
Choosing and Testing Variables for Story Pin Ads
Which Creative Variables to Test First
Once you’ve set up your test structure, it’s time to focus on variables, prioritizing those with the most influence. Start by testing elements that impact retention the most.
The opening frame is critical - it has the biggest influence on whether viewers stay. After that, evaluate the visual style, text overlays, and CTA phrasing. For example, using lifestyle photography - where products are shown in real-world settings - often performs better on Pinterest than polished studio shots. Additionally, compare static images with short-form videos to determine which format leads to higher completion and conversion rates. Here’s a suggested order for testing:
| Priority | Variable | Key Metric to Watch |
|---|---|---|
| 1 | Hook / Opening Frame | Hook Rate (2-second views / impressions) |
| 2 | Visual Style (Lifestyle vs. Studio) | Hold Rate |
| 3 | Text Overlay (size, contrast, message) | Completion Rate |
| 4 | CTA Phrasing and Placement | Click-Through Rate |
If your Story Pin ad includes multiple pages, you’ll also want to test the number of pages and how the narrative flows between them. Pinterest Idea Ads allow up to 20 pages, and the sequence of these pages can significantly impact completion rates.
Testing Audience and Placement Variables
After working on creative elements, shift your focus to audience and placement. This helps you separate the effectiveness of your message from how it’s delivered. To ensure accurate results, keep the ad creative consistent across all variations. If you change the creative, it becomes unclear whether performance differences are due to the audience, placement, or the ad itself.
For audience testing, two approaches stand out:
- Interest-based targeting: Target users based on interests like Home Decor or DIY.
- Lookalike audiences: Build these from your customer list and test different similarity ranges (1% to 10%) to find the right balance between precision and reach.
On the placement side, consider the following:
- Search placements: Ideal for direct response campaigns managed by top PPC agencies, as 96% of top Pinterest search results are unbranded.
- Browse placements: Better suited for building awareness.
How to Design Good Test Variations
Every test should start with a clear hypothesis. For example: "A problem-aware hook will outperform a product-demo hook for cold audiences." This ensures your testing is focused and purposeful.
To avoid skewed results, stick to these design principles:
- Keep layouts clean and easy to read.
- Avoid placing text, logos, or faces in the top 250 px or bottom 340 px of your ad.
- Limit text overlays to cover no more than 20% of the image area.
- Place logos in a corner rather than centering them.
Allocate 15% to 20% of your budget specifically for testing. Following these guidelines will help you run effective tests, setting the stage for accurate analysis later.
Reading and Acting on A/B Test Results
How to Read Key Metrics
When reviewing A/B test results, focus on the metrics that align with your test objectives. Pinterest Ads Manager provides raw data, but it's your job to zero in on the metrics tied to your goals. For example:
- Use CTR (Click-Through Rate) to evaluate how well your hook and hero visuals grab attention.
- Check Completion Rate to assess the pacing of your narrative and content relevance.
- Monitor Exits to identify where viewers lose interest.
- Watch for Taps Back, which can indicate either confusion or high-value content.
| Metric | What It Tells You |
|---|---|
| CTR | Effectiveness of the hook and hero visuals |
| Completion Rate | Narrative pacing and content relevance |
| Exits | Points where viewers drop off |
| Taps Back | Viewer confusion or interest in specific content |
For example, if you see a spike in exits at a specific frame, that frame might lack relevance or clarity. On the other hand, high Taps Back could mean your content is either intriguing or unclear. If completion rates are solid but CTR is low, it might be time to test a stronger call-to-action (CTA) overlay.
However, don’t jump to conclusions too quickly. Always ensure your sample passes validity checks before making decisions.
Confirming Statistical Validity
Before acting on any insights, confirm that your data is reliable. Early positive results can be misleading if your sample size is too small. That’s why statistical significance is key - aim for a 95% confidence level (p < 0.05) before declaring a winner. For creative tests, a 15–20% minimum detectable effect (MDE) is a good benchmark since smaller lifts typically require much larger datasets.
Here are a few guidelines to ensure validity:
- Ensure each variant has at least 1,000 unique viewers to reliably detect a 5% lift.
- Double-check that your traffic split matches the original test plan. A chi-square test is a quick way to verify this.
- Avoid checking results too early. Data from the first 48–72 hours is often unreliable and can lead to poor decisions.
Applying Test Insights to Future Campaigns
Once you’ve validated your results, focus on isolating the specific element that drove the success. Don’t just scale the winning ad - dig deeper to identify whether the hook, pacing, CTA, or another factor was the key driver.
To make future tests more effective:
- Tag creatives with detailed attributes like hook type, CTA style, and messaging angle. This helps identify patterns across multiple tests over time.
- Scale gradually by increasing the winning ad’s budget by 20–30% every 2–3 days. Sudden budget jumps can disrupt the platform’s learning phase.
- Keep a log of each test’s hypothesis, variants, and outcomes. This prevents you from retesting the same variables unnecessarily.
Conclusion: Next Steps for Story Pin Ad A/B Testing
When it comes to multi-page Story Pin ads, even small tweaks can make a big difference in completion and click rates. The process is straightforward: once you identify a winning variation, use it as your new baseline. From there, test one variable at a time. Validate each result before making changes. Allocate most of your budget to proven winners, set aside a smaller portion for testing variations, and reserve a small test budget for fresh ideas. As you scale successful ads, do so gradually to maintain delivery stability. The right tools can streamline this process and make it easier to replicate.
Tools and Resources to Support Your Testing
To speed up testing and improve accuracy, use tools that let you analyze creatives earlier and track performance effectively. Pinterest Ads Manager, the Pinterest Tag, and Conversions API are essential for monitoring results. Adding creative research and pre-launch scoring tools can further refine your approach. If you're searching for specialized tools or services, the Top PPC Marketing Directory is a handy resource. It offers a curated list of options for campaign management, bid optimization, keyword research, ad copy testing, retargeting, and more - perfect for building a structured testing system.
How to Keep Improving Your Pinterest Ads
The real game-changer lies in disciplined documentation. Keep a record of every test, including the hypothesis, variable, and results. This ensures you avoid repeating experiments or making the same mistakes. Follow a logical testing order: start with the concept, then move to the hook, format, offer, and finally, visual style. Each test result should inform the next iteration of your Story Pin ads, following a structured PPC campaign optimization checklist to ensure consistent growth. By sticking to this cycle, you'll continuously refine your strategy and see better results over time.
FAQs
How long should a Pinterest A/B test run?
Pinterest recommends running A/B tests for at least 7 days when testing creative elements and up to 14 days for audience tests. This timeframe helps gather sufficient data while factoring in any weekly trends or patterns.
What should I test first in an Idea Ad?
The hook or opening visual is the most critical element to test in an Idea Ad. Why? Because it plays a huge role in grabbing attention and determining if viewers stick around or keep scrolling. Try experimenting with different approaches, such as starting with a compelling question, highlighting a relatable pain point, or showcasing an outcome-driven promise. These tweaks can make a big difference in boosting engagement and overall performance.
How do I know if a winning ad is statistically valid?
When an ad achieves a confidence level of 95% or higher, it means the results are highly unlikely to be due to random chance. Alongside this, the p-value must be below 0.05 to confirm statistical significance. Meeting these criteria ensures your test results are dependable and provide a solid foundation for making informed decisions to enhance ad performance.