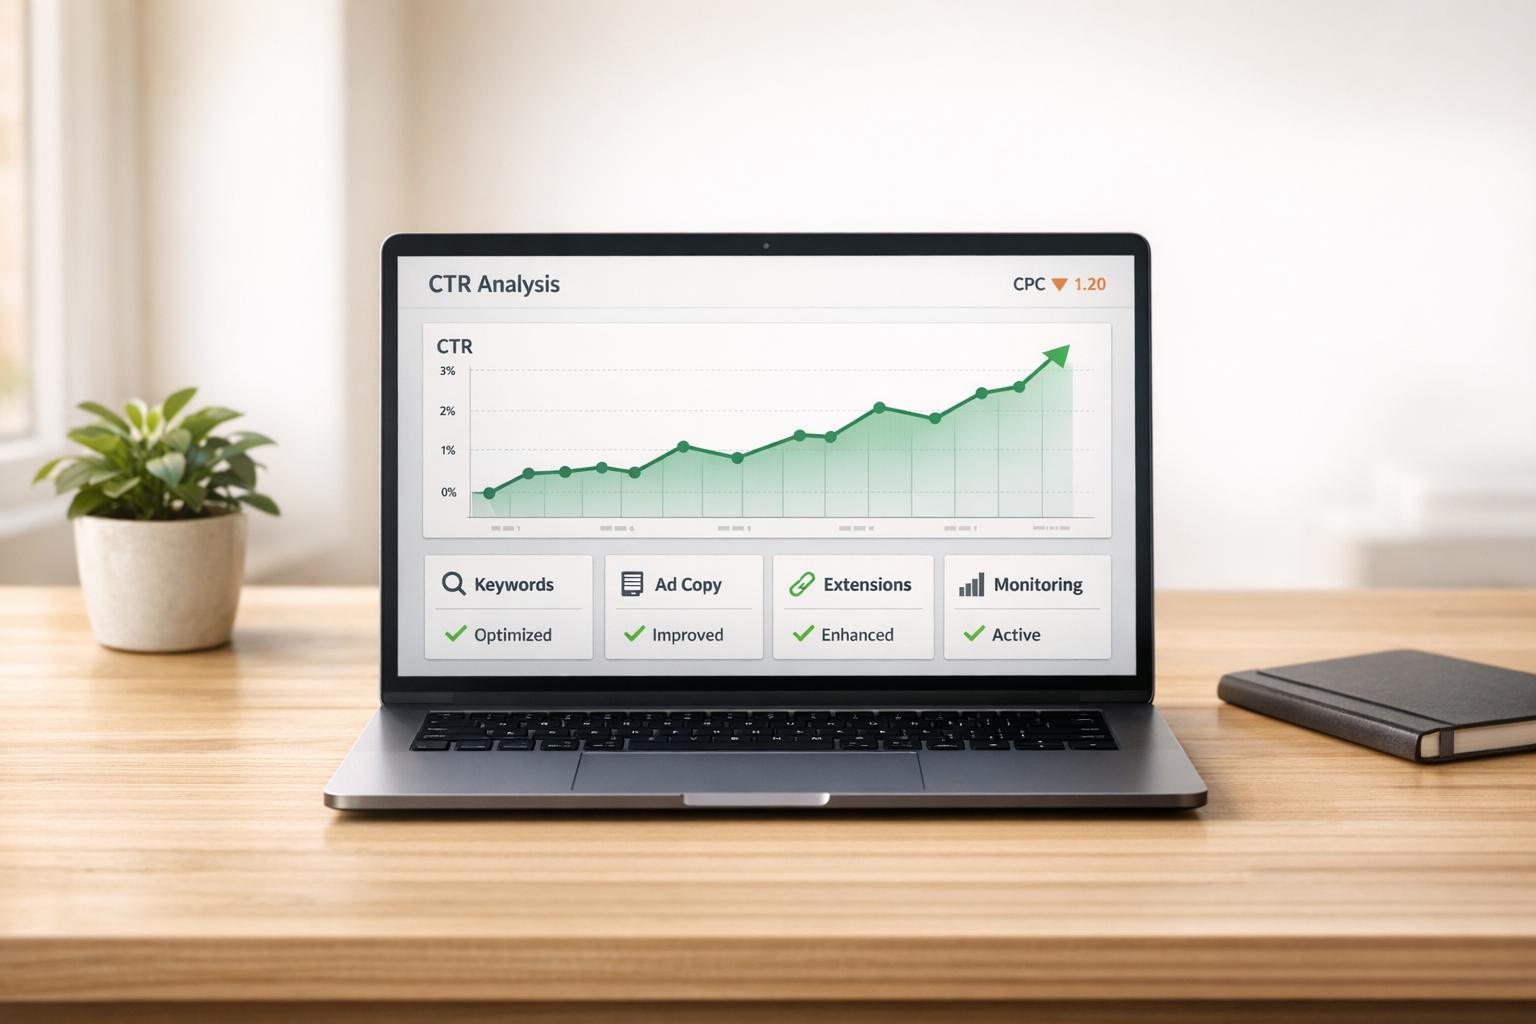
Running a PPC campaign without benchmarks is like driving without a map - you can’t tell if you’re heading in the right direction. Are your $5.26 CPC or 6.66% CTR good or bad? The answer lies in comparing your metrics to industry standards.
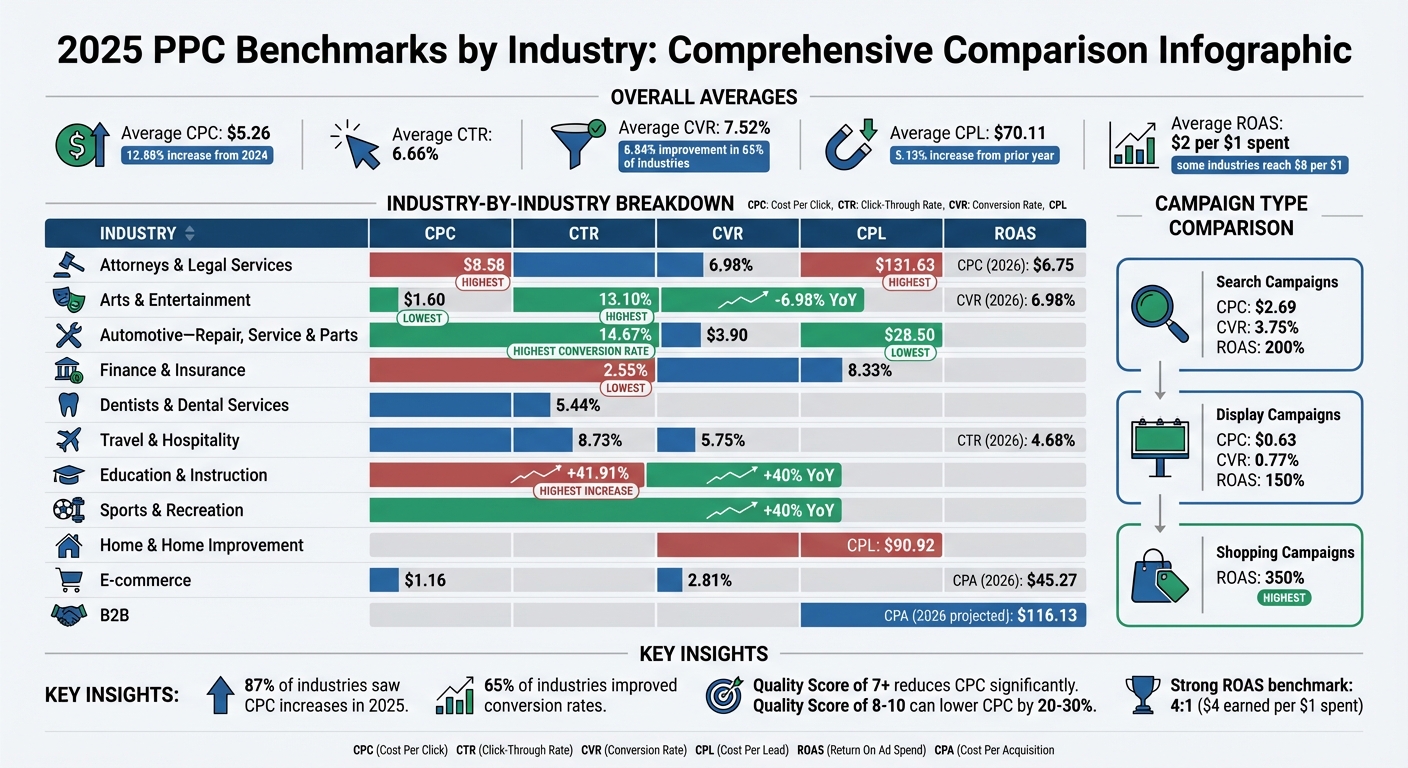
Here’s the key takeaway: PPC benchmarks help you evaluate performance, identify areas for improvement, and justify budgets. For example, Attorneys & Legal Services average $8.58 per click, while Arts & Entertainment pay just $1.60. Conversion rates also vary widely: Automotive leads at 14.67%, while Finance lags at 2.55%.
This guide breaks down:
- Core PPC KPIs: CTR, CPC, CPA, ROAS, and more.
- How to find benchmarks: Reliable sources like WordStream and LocaliQ.
- Steps to analyze gaps: Build tables to compare costs, engagement, and profitability.
- Actionable insights: Use benchmarks to optimize budgets, improve ad quality, and boost ROI.
The bottom line? Benchmarks are your best tool for understanding if your campaigns are delivering results or need a course correction.
2025 PPC Benchmarks by Industry: CPC, CTR, CVR and CPL Comparison
Compare Your Account Performance Against Your Competition's | PPC Vertical Benchmarks
Step 1: Know the Main PPC KPIs
To run a successful PPC campaign, you need to grasp the core metrics that measure engagement, conversions, and financial performance. These six key KPIs form the backbone of effective campaign analysis. Let’s break them down to understand their significance.
CTR (Click-Through Rate) and CPC (Cost Per Click)
Click-Through Rate (CTR) represents the percentage of people who click on your ad after seeing it. It's calculated using the formula: (Clicks ÷ Impressions) × 100. For 2025, the average CTR across industries is 6.66%, with notable variations - Dentists & Dental Services average 5.44%, while Arts & Entertainment hit 13.10%. A strong CTR indicates that your ad resonates with your audience.
Cost Per Click (CPC) reflects how much you pay for each click on your ad. The average CPC in 2025 is $5.26, but this varies significantly by industry. For instance, Attorneys & Legal Services pay $8.58 per click, while Arts & Entertainment only pay $1.60. Factors like your bid, competition, and ad quality influence CPC. A high Quality Score (7 or above) can help reduce this cost.
CPA (Cost Per Acquisition) and Conversion Rate
Clicks are great, but conversions are what really matter. These metrics show how well your campaign turns clicks into meaningful actions.
Conversion Rate (CVR) measures the percentage of clicks that result in a desired action, calculated as (Conversions ÷ Clicks) × 100. The 2025 average CVR is 7.52%, with Automotive - Repair, Service & Parts leading at 14.67%, while Finance & Insurance lag behind at 2.55%. If your CTR is high but your CVR is low, it might indicate issues with your landing page.
Cost Per Acquisition (CPA) shows how much it costs to acquire a single customer or lead. It’s calculated by dividing total ad spend by total conversions. This metric directly impacts profitability. Paying more per click can be worth it if it ultimately lowers your CPA.
"Ultimately, cost per lead, when used in tandem with lead value tracking, is the most important PPC metric because it directly reflects the value generated from advertising efforts".
ROAS (Return on Ad Spend) and CPL (Cost Per Lead)
Return on Ad Spend (ROAS) measures how much revenue you generate for every dollar spent on ads. The formula is simple: Revenue ÷ Ad Spend. A ROAS of 4:1 (earning $4 for every $1 spent) is considered strong in most industries. On average, companies earn $2 for every $1 spent on PPC, with some reporting returns as high as $8 per $1.
Cost Per Lead (CPL) calculates how much you spend to generate a single lead. In 2025, the average CPL is $70.11, marking a 5.13% increase from the prior year. However, CPL varies widely by industry - Attorneys & Legal Services average $131.63 per lead, while Automotive - Repair, Service & Parts pay just $28.50. The goal is to balance cost and quality. A $130 lead is only worthwhile if it translates into revenue.
Understanding these KPIs allows you to benchmark performance and fine-tune your campaigns for better results across different industries.
Step 2: Collect Industry Benchmark Data
After identifying your core KPIs, the next move is to gather reliable benchmark data. This helps you understand how your campaigns measure up against competitors. For example, knowing whether your $5.26 CPC and 7.52% conversion rate align with industry norms is crucial. The key is finding trustworthy sources to provide accurate, up-to-date benchmarks.
Find Reliable Benchmark Sources
To ensure accuracy, rely on data from sources that analyze large volumes of campaigns. WordStream and LocaliQ publish annual reports based on over 16,000 U.S.-based search advertising campaigns spanning various industries. Look for reports with specific timeframes, such as "April 2024 through March 2025", to ensure the data reflects current trends.
For real-time insights, Databox Benchmark Groups provide live, anonymized performance data. This is especially important since search advertising costs have been steadily increasing for the past five years. Even data that’s just a year old might not reflect current conditions - average CPCs rose by 12.88% between 2024 and 2025 alone. For context, the median number of Google Ads impressions across industries was 42.87K as of late 2023.
Specialized reports from agencies like WebFX, SearchKings, and Optmyzr offer deeper insights tailored to niche sectors. Always verify when the data was last updated - outdated figures can mislead your budgeting and strategy. Resources like the Top PPC Marketing Directory (https://ppcmarketinghub.com) are also helpful for finding detailed industry data and research studies.
Main Industries to Compare
When benchmarking, focus on industries with distinct consumer behaviors and significant search volume. For instance, Automotive - Repair, Service & Parts leads with a conversion rate of 14.67%, while Finance & Insurance lags at 2.55%.
Other key industries to consider include:
- Healthcare (Physicians & Dentists)
- Education & Instruction
- Real Estate
- E-commerce
- Travel
These industries vary in intent levels and ad formats. For example, Real Estate often relies on feed-based Performance Max campaigns, which tend to have lower average CPCs than traditional search ads. Meanwhile, Travel and E-commerce see higher engagement rates, thanks to visually-driven ad formats.
When analyzing data, segment by intent levels. Industries like Construction and Healthcare may have lower click volumes but typically achieve higher intent and conversion rates compared to retail sectors. Cross-referencing multiple sources is essential for identifying consistent benchmarks. Avoid relying on "all-industry" averages - they don’t provide the specificity needed for targeted campaign goals. Use this data to create detailed comparison tables in the next step.
Step 3: Build Comparison Tables for Metrics
After collecting your benchmark data, the next move is organizing it into comparison tables. These tables simplify the process of spotting trends, identifying cost-effective areas, and evaluating where your campaigns stand. Use median values in your tables to balance out any outliers and keep the data meaningful.
Create CPC and CPL Comparison Tables
Design tables that separate Cost-Per-Click (CPC) and Cost-Per-Lead (CPL) metrics. This allows you to quickly identify where you're spending efficiently. For example, the 2025 Google Ads benchmarks reveal that Automotive - Repair & Parts has a CPC of $3.90 and a CPL of $28.50, while Attorneys & Legal Services shows much higher costs at $8.58 CPC and $131.63 CPL.
To deepen the analysis, include performance tiers in your tables. Add columns for the median, "Top 25%" (industry leaders), and "Bottom 25%" (areas needing improvement). This tiered structure provides a clearer view of where your campaigns rank in the competitive landscape. Additionally, break down your tables by campaign types. For instance, Search campaigns tend to have higher CPCs ($2.69) but better conversion rates (3.75%) compared to Display campaigns, which average $0.63 CPC and a 0.77% conversion rate.
For better usability, incorporate color-coding in your spreadsheets or dashboards. Use green to highlight metrics that outperform industry averages and red for those that lag behind. Sortable columns can also make it easier to pinpoint gaps and opportunities.
Compare CTR and Conversion Rate Trends
After cost metrics, shift your focus to engagement trends like Click-Through Rate (CTR) and Conversion Rate. Create separate tables to track these metrics, pairing them with volume indicators like impressions or clicks. This helps you determine whether strong performance stems from a niche audience or broader reach. For instance, the Travel industry leads with an 8.73% CTR and a 5.75% conversion rate, while Finance & Insurance shows a slightly lower CTR of 8.33% but a much lower conversion rate of 2.55%.
Enhance these tables by including contextual metrics alongside engagement data. For example, combine cost metrics (like CPC) with engagement metrics (CTR) and profitability measures (such as ROAS) in a single view. This approach ensures you're not making decisions based solely on cost, as higher costs in some industries are often justified by better conversion values.
Track ROAS and Growth Trends
Once you've reviewed cost and engagement data, turn your attention to profitability and growth by tracking Return on Ad Spend (ROAS). Build tables that not only show ROAS but also highlight year-over-year growth trends. For instance, Shopping campaigns tend to deliver an average ROAS of 350%, compared to 200% for Search campaigns and 150% for Display campaigns.
Keep in mind that a lower ROAS in high-margin industries can still outperform a higher ROAS in low-margin ones. To get a comprehensive view, add columns for metrics like profit margins or customer lifetime value (CLV). Tools such as Databox Benchmark Groups can also be useful, offering real-time, anonymized data that integrates directly into your dashboards. These tools allow you to visualize how your performance stacks up against industry benchmarks.
sbb-itb-89b8f36
Step 4: Review Performance Gaps and Trends
With your tables ready, the next step is to pinpoint performance gaps and identify trends by comparing your metrics with industry benchmarks. Using your comparison tables, organize the data by industry to uncover specific areas where performance might be lagging.
Group Data by Industry Type
Every industry operates differently, so analyzing your data by business model is essential for accurate insights. For instance, B2B campaigns often deal with longer sales cycles and higher costs - projected to average $116.13 per acquisition in 2026. In contrast, Ecommerce campaigns move quickly, with acquisition costs averaging $45.27. What’s considered a strong metric also varies: a 3% conversion rate might excel in B2B software but would raise concerns for an online retailer.
Legal services, for example, handle high costs that are justified by the significant revenue each client represents. The industry averages a CPC of $6.75 and a 6.98% conversion rate. Compare that to Ecommerce, where a $1.16 CPC and 2.81% conversion rate reflect a focus on high volume and tighter margins.
"In industries like Home & Home Improvement, where the average CPL is already $90.92, focusing on better lead quality over sheer quantity is critical".
Track Year-Over-Year Changes
Look at historical data to see if performance gaps are narrowing or widening over time. For instance, in 2025, CPC rose in 87% of industries, with an average increase of 12.88%. On the flip side, conversion rates improved in 65% of industries, with an average boost of 6.84%. Rising costs don’t always indicate poor performance - they often reflect heightened competition in lucrative markets.
Watch for outliers. In 2025, Education & Instruction saw a 41.91% jump in CPC due to increased competition. Meanwhile, Arts & Entertainment experienced a CPC drop of 6.98%, signaling reduced advertiser demand.
"Costs are rising, but so is performance - 65% of industries saw better conversion rates in 2025. The main takeaway here is that a smart strategy beats cheap clicks".
With these trends in mind, prioritize sectors that show the most potential for growth.
Find High-Growth Opportunities
Industries with significant conversion rate improvements despite rising costs often present the best growth opportunities. For example, Sports & Recreation and Education both saw conversion rates jump by over 40% year-over-year, signaling strong demand and market stability. If your CTR is below industry benchmarks - like falling short of 5.44% for Dentists - reassess your keyword targeting and optimize ad assets such as sitelinks or image extensions.
Focus on sectors where engagement remains strong despite higher costs. Travel and Hospitality, for instance, maintained a 4.68% average CTR in 2026, showing steady consumer interest. For campaigns struggling with conversion rates, experiment with new landing page actions or use offline conversion tracking to provide better data for automated bidding systems. High costs can be worthwhile when conversion values justify the investment - Legal services, with a $6.75 CPC and a 6.98% conversion rate, exemplify how high-intent traffic can deliver strong returns.
Step 5: Use Insights to Improve Campaigns
Take what you've learned from your data and apply it to make your campaigns work better. This means setting realistic goals, redistributing budgets, and keeping a close eye on performance using tracking tools.
Set Achievable Campaign Goals
Use your performance trends as a starting point for practical improvements. Industry benchmarks can offer guidance, but your own numbers often matter more. For example, calculating your break-even ROAS (Return on Ad Spend) is key. The formula is simple: 1 ÷ Average Profit Margin %. If your profit margin is 25%, you’ll need a 4.0x ROAS just to break even.
This is critical because what works for one industry might not work for another. A 4x ROAS might be a win for a software company with high margins, but it could spell trouble for a retailer with thinner margins. High-value industries like Legal Services or Enterprise SaaS often accept lower ROAS or higher CPL (Cost Per Lead) because the long-term customer value justifies the upfront cost.
Some advertisers are now looking past basic ROAS metrics, using measures like Profit on Ad Spend (POAS) or Media Efficiency Ratio (MER) to factor in fixed costs, returns, and even the indirect benefits of ads, such as organic traffic boosts.
"Benchmarks are a guide, not a law." - GrowthConductor
Adjust Budget Allocation
Revisiting how you allocate your budget can lead to measurable improvements - sometimes boosting ROAS by 15–25%. Start by reviewing performance data by region or device. For example, if certain states or mobile traffic show high clicks but low conversions, try reducing bids or pausing those segments altogether.
For lead-generation businesses, offline conversion tracking (OCT) is a game-changer. By linking your CRM (like HubSpot or Salesforce) to Google Ads, you can optimize for actual revenue ("Closed Won" deals) instead of just form submissions.
"Diversifying your advertising spend across different platforms can help offset rising costs on any single platform. This allows you to reach different audiences while reallocating budgets to the ad publishers that deliver the best conversions." - Katia Hausman, Vice President of Product, LocaliQ
It may also be worth testing new platforms. If Google Ads CPCs are rising too fast in your industry, try Microsoft Ads or social media platforms to find untapped audience segments at a lower cost. For industries that deal with seasonal spikes, like Travel, automated bidding adjustments can help your campaigns capitalize on peak periods, such as Spring Break.
Use Tools for Continuous Tracking
Once your budgets are fine-tuned, ongoing tracking becomes essential. Tools like Databox allow real-time monitoring of metrics like CTR, CPC, and ROAS, and even let you compare your performance against anonymized data from similar companies. Visual dashboards with benchmarks make it easier to spot trends and address gaps quickly.
Another strategy is uploading customer lists to Performance Max campaigns for AI-driven targeting. Improving your Quality Score to a range of 8–10 can also lower CPC by 20–30%, giving you more mileage out of your budget.
For more resources, check out the Top PPC Marketing Directory (https://ppcmarketinghub.com), which offers tools, expert agencies, and management guides to help you continuously refine your campaigns and stay ahead of the competition.
Conclusion
Comparing PPC KPIs across industries is key to understanding whether your campaigns stack up against the competition. Without industry benchmarks, it’s hard to tell if metrics like a $5.26 CPC or a 7.52% conversion rate are truly competitive. Recent trends show rising costs paired with better performance, making a well-thought-out strategy more critical than ever.
Using the five-step framework allows you to benchmark effectively, uncover areas for improvement, and fine-tune your campaigns. Regular benchmarking can help you catch trends early - like the 12.88% average CPC increase across industries - so you can adjust budgets and bidding strategies accordingly. This approach not only provides clarity on your current performance but also helps you stay flexible as market dynamics shift.
Remember, benchmarking isn’t a one-time task - it’s an ongoing necessity. Digital advertising changes quickly, and relying on past performance alone won’t cut it. Tools offering real-time tracking and peer insights can keep you nimble and prepared for whatever comes next.
For expert tools and resources, check out the Top PPC Marketing Directory.
FAQs
How can I tell if my PPC campaign metrics are competitive in my industry?
To gauge whether your PPC campaign metrics are on par with the competition, it's helpful to compare them against industry benchmarks for key performance indicators (KPIs) such as click-through rate (CTR), cost per click (CPC), conversion rate, and return on ad spend (ROAS). These benchmarks represent averages across different industries, giving you a clearer picture of how your campaigns stack up against others in your field.
For instance, if your CTR falls below the industry average, it might signal that your ad copy or targeting needs improvement. Conversely, a higher-than-average CPC could mean it's time to revisit your bidding strategy. By regularly reviewing updated benchmarks, you'll stay in tune with industry trends, pinpoint areas that need attention, and identify strengths you can capitalize on.
If you're looking for tools and services to fine-tune your campaigns, the Top PPC Marketing Directory is a great resource. It offers insights into PPC tools, agencies, and strategies designed to meet your specific goals.
What are the best sources for reliable PPC benchmark data?
Reliable PPC benchmark data is often found in reports and platforms that analyze extensive campaign metrics. Trusted sources provide detailed insights into key metrics like click-through rates (CTR), cost-per-click (CPC), and conversion rates across different industries. These benchmarks help you measure how your campaigns stack up against industry standards.
Focus on platforms that frequently update their data and cover major advertising channels like Google Ads, Facebook, and LinkedIn. Leveraging this information can help you spot trends, set achievable goals, and fine-tune your campaigns for better results.
How do industry benchmarks help improve PPC campaign performance?
Industry benchmarks can be a game-changer for sharpening your PPC campaigns. These benchmarks offer key performance indicators (KPIs) like click-through rate (CTR), cost per click (CPC), conversion rate, and return on ad spend (ROAS). Essentially, they act as a yardstick to measure how your campaign is performing compared to industry standards.
For example, if your CTR falls short of the average, it might be time to tweak your ad copy or refine your audience targeting. On the other hand, if your CPC seems unusually high, you could experiment with adjusting your bidding strategy or pivoting to more budget-friendly keywords. Keeping a close eye on these benchmarks helps ensure your campaigns remain competitive and efficient, while staying aligned with your objectives. Over time, this approach can lead to stronger results and a better return on your investment.