Cross-platform A/B testing is about comparing ad performance across platforms like Google Ads, Amazon PPC, and Microsoft Advertising to find what works best for your campaigns. Instead of testing within a single platform, this approach looks at how different ecosystems, algorithms, and audience behaviors impact results. Here's why it matters:
- Diversify and Reduce Risks: Relying on one platform can be risky. Testing across multiple platforms helps spread out your budget and reduce dependency on a single algorithm.
- Platform-Specific Insights: Each platform has unique metrics and user behaviors. For example, Amazon focuses on ACOS, while Google prioritizes Quality Score.
- Performance Boosts: Microsoft, for instance, might drive 44% of conversions even with a smaller budget compared to Google Ads.
Key takeaways:
- Run tests for 2–4 weeks with at least 500–1,000 impressions per variation.
- Focus on one variable at a time (e.g., ad copy, bidding strategies).
- Aim for 95% confidence in results before making changes.
The article dives into platform-specific strategies for Google Ads, Amazon PPC, and Microsoft Advertising, detailing cross-platform PPC tools, testing setups, and metrics to track. Whether you're managing e-commerce campaigns or B2B ads, cross-platform testing helps you allocate budgets effectively and improve ROI.
EP81: Case Study - Increase PPC Conversions 32% With a Multi-Platform Marketing Approach
sbb-itb-89b8f36
1. Google Ads
Google Ads dominates the global search engine market, holding a massive 89.74% share. To help advertisers optimize their campaigns, Google offers several built-in tools tailored for A/B testing. These tools are designed to address different elements of campaigns and specific testing goals.
Testing Methodologies
Google Ads Experiments (also known as Custom Experiments) is the go-to tool for testing major strategic changes. It splits traffic and budget - usually 50/50 - between your original campaign and a test version. This setup is perfect for evaluating bidding strategies like Target CPA versus Target ROAS or testing different audience segments. The biggest advantage? Both versions run simultaneously, ensuring external factors like holidays or market changes impact them equally.
For testing ad copy, Ad Variations allows you to experiment with specific elements across multiple campaigns. It’s a quicker way to see if a new call-to-action or headline resonates with your audience. Meanwhile, geo-based testing enables you to test different versions in separate regions - like California versus Texas - helping you account for seasonality and uncover regional preferences. If your account has limited traffic, time-based testing can be an option, comparing performance before and after a change. However, this method is more susceptible to seasonal bias.
"A/B testing is an essential approach digital marketers use to continuously improve the results of their ad campaigns."
– Elad Shochot, Tachles-marketing.com
Setup and Tools
The Google Ads Experiments Tool can be found under the "Campaigns" tab and works with Search, Performance Max, and Video campaigns. To use it, create a draft of your proposed changes, then launch it as a formal experiment with your chosen traffic split.
For manual tests within a single ad group, set Ad Rotation to "Do not optimize." You can also choose between cookie-based splits (ensuring users see the same version consistently) or random splits (where users might encounter different versions on separate visits). To test landing pages, consider external tools like heatmaps or session recordings to identify key performance drivers.
Performance Analysis
When analyzing results, focus on primary metrics like Cost Per Acquisition (CPA), Return on Ad Spend (ROAS), and Conversion Rate. Make sure tests reach a 95% confidence level to rule out random chance. For smaller campaigns, aim for at least 100–300 conversions before making decisions. High-traffic accounts should target around 1,000 clicks per variation.
Secondary metrics like Click-Through Rate (CTR) and Quality Score are also important. For instance, a variation that boosts conversions but lowers Quality Score can hurt long-term performance. A standout example comes from a Nutrition/Health Product Company that, in January 2026, reduced CPA from $48.39 to $8.92 (an 82% drop), achieved a ROAS increase from 122% to 790%, and improved their conversion rate from 1.36% to 8.77% by refining bids and targeting keywords.
"Testing your ads is one of the fastest ways to improve Quality Score and overall performance."
– Montana Thomas, Quick Sprout
To get accurate results, run tests for at least 2–4 weeks. This timeframe captures both weekday and weekend behaviors and avoids periods of volatility caused by external factors. Keeping a detailed log of hypotheses, setups, and outcomes ensures you build a valuable playbook over time, avoiding repeated efforts on the same ideas.
Up next, we’ll dive into Amazon PPC and how its A/B testing strategies compare.
2. Amazon PPC
Amazon offers two main approaches for A/B testing: "Manage Your Experiments" (MYE) for listing content like images, titles, and A+ content, and manual split testing for PPC campaign elements such as keywords, bids, and ad formats. Unlike Google Ads, which comes with built-in experimentation tools for PPC campaigns, Amazon requires sellers to manually create separate test groups to analyze PPC-specific variables with platforms like Optmyzr.
Testing Methodologies
Amazon PPC testing revolves around "Retail Readiness", ensuring that listing elements align with ad variables to effectively convert the traffic your ads bring in. Testing often includes match types (e.g., Exact vs. Broad) and bidding strategies (e.g., Dynamic vs. Fixed) using tools like AiHello, both of which work in conjunction with Amazon's A9 algorithm. Brands that consistently A/B test their ad creatives report an average of 35% better engagement and 20% higher conversions within 60 days.
"A/B testing without a hypothesis? That's just expensive guessing, honestly."
– Ash Metry, Founder & CEO, Keywords.am
For listing elements, MYE automatically splits traffic evenly (50/50) between visitors. However, this feature is only available to Brand Registry-enrolled sellers with high-traffic ASINs. When testing PPC campaigns, you need to create separate ad groups within the same campaign and distribute budgets equally. A minimum daily budget of $50 per variant is recommended to generate meaningful data. Avoid running tests during major shopping events like Prime Day or Black Friday, as these periods can distort results due to unusual shopper behavior and heightened competition.
These strategies form the groundwork for testing, but the next step is understanding how to set up these experiments using Amazon's tools.
Setup and Tools
Start with a hypothesis based on keyword data. For example, in early 2026, a stainless steel tumbler seller used MYE to test a revised product title. Over four weeks, they achieved 97% statistical confidence, an 18% increase in conversion rate, and better organic rankings.
| Element | Impact Potential | Primary Metric |
|---|---|---|
| Main Image | Very High | Click-Through Rate (CTR) |
| Product Title | High | Search Visibility & CTR |
| A+ Content | High | Conversion Rate (CVR) |
| Bid Strategy | Medium-High | ROAS and Placement |
Focus on testing the main image first - it has the greatest impact on CTR - followed by the product title and then A+ content. Amazon's "Auto-publish" feature in MYE can automatically update your listing once a winning variation is determined. For PPC tests, isolate a single variable at a time, such as keyword match type or bidding strategy, to ensure you can clearly identify what drives performance changes.
Performance Analysis
Key metrics to track include ACoS, ROAS, and Units Sold per Unique Visitor. Only implement changes once you achieve 95% statistical confidence, which typically takes 4–10 weeks. With the average cost per click on Amazon rising from $1.20 to $1.78 between 2023 and 2025, conducting efficient and cost-conscious tests has become even more important.
"Proper management isn't about throwing money at ads; it's about data-backed precision."
– Bridgeway Digital
Additionally, monitor secondary metrics like CTR and ad position to assess visibility changes. If a test yields inconclusive results, it’s not a failure - it simply means the variation wasn’t impactful enough to shift customer behavior. This insight can guide you to try bolder changes in future tests. Sponsored Display retargeting, for instance, delivers 40% higher conversion rates than cold traffic, making audience segmentation a valuable area for experimentation.
Next, we’ll explore how Microsoft Advertising's testing capabilities stack up against both Google and Amazon.
3. Microsoft Advertising
Microsoft Advertising takes insights from platforms like Google Ads and Amazon PPC and adds its own twist with unique testing tools for search campaigns. The platform allows you to duplicate your search campaign while setting a specific budget and dividing traffic between the original and test campaigns. This approach not only minimizes risk but also enhances your overall cross-platform strategy. A standout feature for B2B advertisers is the ability to integrate LinkedIn profile data - like job titles, company size, and industry - into experiments, enabling highly targeted audience segmentation.
Testing Methodologies
Microsoft offers two ways to split users for testing. With traffic-based splits, users are randomly shown either the original ad or the test ad during each search. This method often reaches statistical significance faster. On the other hand, cookie-based splits assign users to one group for the entire test, providing more precise individual response data but requiring more time to complete.
A smart starting point is running an A/A test for the first two weeks. This involves keeping both campaigns identical to confirm the experiment is set up correctly before making any changes. When testing bidding strategies like Target CPA or Maximize Conversions, Microsoft recommends running the test for at least four weeks and ensuring 20–30 conversions within 30 days before switching to automated bidding. For most tests, a 50% traffic split is ideal, though campaigns with lower traffic may need a higher split to gather enough data.
"This way, you can run a true A/B test within a campaign to determine whether a particular update will work well for you and your business."
– Subha Hari, Senior Program Manager, Microsoft Advertising
Setup and Tools
The Experiments Tab in Microsoft Advertising simplifies the process by creating a controlled duplicate of your campaign. You can set a traffic split percentage (from 1% to 99%) to allocate the budget between the base and experimental campaigns. Automated Imports also make it easy to sync campaigns across platforms, streamlining cross-platform testing.
One key rule: don’t make changes to the base campaign during an active experiment. Any modifications won’t sync and could invalidate your results. If you need to adjust the budget, update it in the base campaign, and the new amount will be split according to your defined percentage. Keep in mind that experiments currently don’t support shared budgets or Dynamic Search Ads.
Performance Analysis
Microsoft Advertising uses a color-coded system to evaluate test results: green means the experiment outperformed the original, red signals worse performance, and grey shows no significant difference. Metrics like Top Impression Share and Absolute Top Impression Share are especially useful for understanding how ad placement impacts performance during testing.
Once your test concludes, you can either apply the experiment settings to the base campaign or turn the experiment into a standalone campaign. Microsoft Advertising has some compelling advantages: its users spend 22% more than the average internet searcher, and cost-per-click rates are often 32.5% to 59% lower than Google Ads, depending on the industry. One case study even highlighted an advertiser achieving a 487% ROAS on Microsoft compared to 334% on Google.
"Most searchers do not switch search engines, so the ones you reach through Bing/Yahoo are unique from the audience on Google."
– Stephanie White, Account Manager, Hanapin Marketing
These features give advertisers the tools to fine-tune their campaigns and integrate them seamlessly into a broader cross-platform strategy.
Pros and Cons
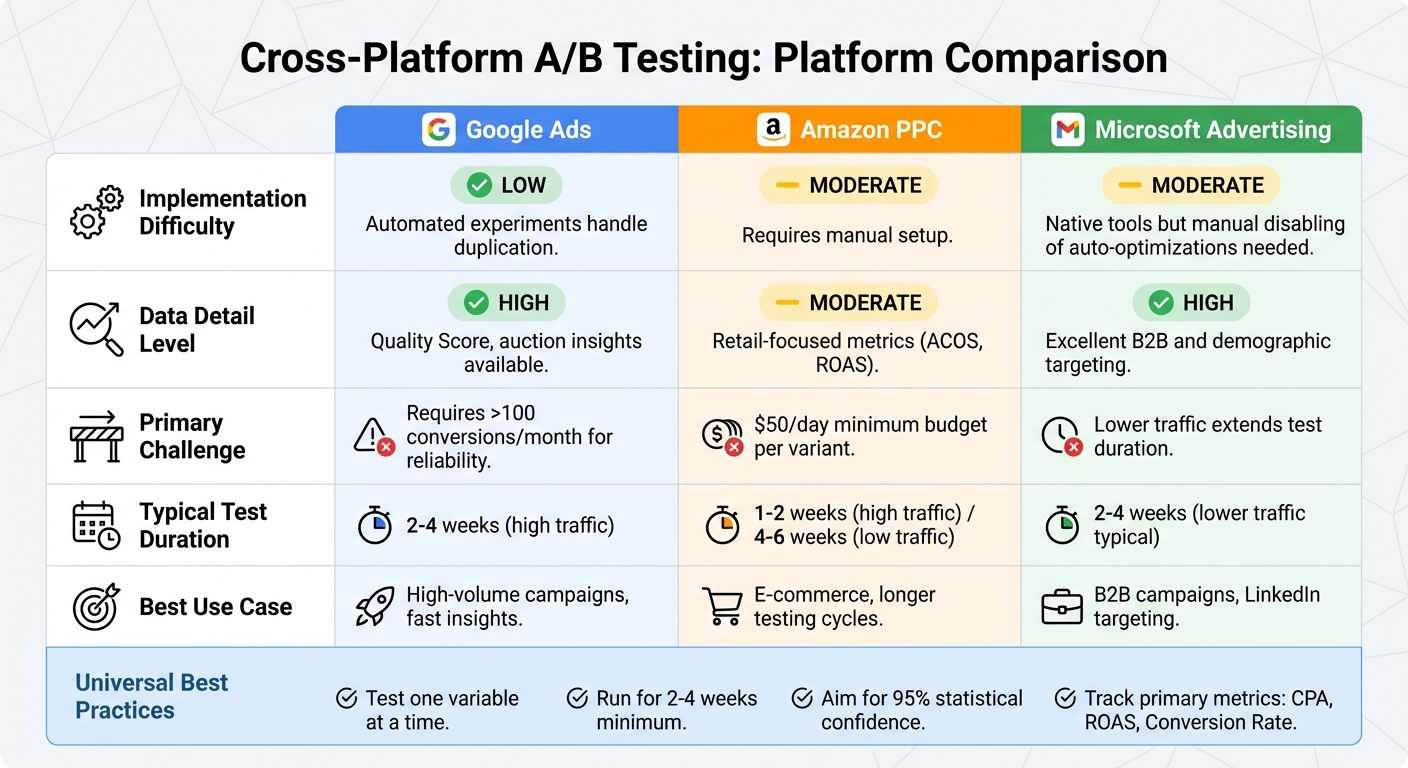
Cross-Platform A/B Testing Comparison: Google Ads vs Amazon PPC vs Microsoft Advertising
When it comes to testing strategies across platforms, each offers a mix of strengths and challenges, often requiring specialized PPC management and optimization solutions to scale effectively. Here's a closer look at Google Ads, Amazon PPC, and Microsoft Advertising to help you decide which fits your goals.
Google Ads is known for its straightforward setup, thanks to automated experiments that handle duplication and traffic splitting seamlessly. It provides detailed data insights, such as Quality Score and auction insights, making it easier to pinpoint what drives performance. However, achieving statistically reliable results requires a high conversion volume, and testing automated bidding strategies can reset the learning phase, causing temporary fluctuations in performance.
Amazon PPC requires manual effort to set up tests. You'll need to create control and test groups within Campaign Manager or use third-party tools like Helium 10 or Jungle Scout. The platform is tailored for retail campaigns, focusing on metrics like ACOS and ROAS. While high-traffic campaigns can yield results in just 1–2 weeks, lower-traffic ads may take 4–6 weeks to reach significance.
Microsoft Advertising strikes a balance with its native experiment tools, similar to Google’s. However, you’ll often need to manually disable automated settings, such as ad rotation optimizations, which can add complexity. The platform shines in B2B marketing, leveraging LinkedIn profile data for precise targeting. That said, lower traffic levels mean tests typically take 2–4 weeks for meaningful results.
| Platform | Implementation Difficulty | Data Detail | Primary Challenge |
|---|---|---|---|
| Google Ads | Low: Automated experiments handle duplication | High: Quality Score, auction insights | Requires >100 conversions/month for reliability |
| Amazon PPC | Moderate: Requires manual setup | Moderate: Retail-focused metrics (ACOS, ROAS) | $50/day per variant |
| Microsoft Advertising | Moderate: Native tools but manual disabling of auto-optimizations needed | High: Excellent B2B and demographic targeting | Lower traffic extends test duration |
This breakdown highlights how each platform aligns with different needs. Use Google for high-volume campaigns and fast insights, Amazon for longer e-commerce testing cycles, and Microsoft for B2B campaigns, even if they take a bit longer to yield results.
Conclusion
Cross-platform A/B testing can be straightforward when you stick to a few essential principles. Focus on testing one variable at a time, run experiments for 2–4 weeks, and aim for 95% statistical confidence [2, 18, 20, 38]. These guidelines work for campaigns across Google Ads, Amazon PPC, and Microsoft Advertising, reinforcing the platform-specific strategies covered earlier.
"Testing is one of the most rewarding things a PPC marketer can do... running tests like a scientist provides conclusive evidence one way or another. Nobody can argue with a factual outcome." – ppc.io
Keep a detailed log of every hypothesis, test setup, and result. This habit not only prevents redundant efforts but also helps you develop a customized playbook for ongoing improvement [2, 18, 20]. Be sure to analyze results by device and source to account for differences across platforms.
For added support, the Top PPC Marketing Directory (https://ppcmarketinghub.com) connects you with agencies, tools, and performance resources tailored for A/B testing, campaign management, and tracking. These resources can help you tackle platform-specific challenges, meet the recommended 10,000-session threshold for reliable test results, and keep your optimization processes running smoothly.
Plan to launch new tests every 30–60 days to keep pace with changing consumer behavior. Whether you're refining ad copy to boost CTR or adjusting bidding strategies to improve ROAS, regular testing is the key to turning good campaigns into outstanding ones. These strategies complement the testing approaches for Google Ads, Amazon PPC, and Microsoft Advertising discussed earlier.
FAQs
How can I compare results across Google, Amazon, and Microsoft?
To effectively compare results across Google, Amazon, and Microsoft, start by aligning your KPIs with each platform's specific metrics. For instance, focus on ROAS (Return on Ad Spend) for Google, CPL (Cost Per Lead) for Amazon, and CTR (Click-Through Rate) for Microsoft.
Using unified reporting tools can simplify the process by aggregating data from all platforms into a single view. Additionally, ensure you implement consistent tracking methods, such as UTM parameters, to maintain accuracy when measuring performance. This approach allows for clear, side-by-side comparisons, making it easier to fine-tune budgets and make informed decisions across these platforms.
What sample size is enough if my campaigns have low traffic?
When running low-traffic campaigns, determining the right sample size hinges on the confidence level you want and the margin of error you're comfortable with. To ensure your A/B test results are solid, you'll need enough data to spot real differences. This often means continuing tests until you hit a statistically significant number of visitors - usually in the range of hundreds or even thousands. Even with limited traffic, this approach helps maintain reliable results.
Which variable should I test first to improve ROI fastest?
Start by focusing on your ad headline - it’s the first thing people notice and plays a huge role in driving click-through rates. A well-crafted headline can instantly grab attention, spark interest, and lead to a noticeable increase in engagement and ROI.