If you switch attribution models, your PPC results can look different even when nothing changed in the business. I’d treat this as a reporting and bidding choice - not a truth-setting exercise.
Here’s the short version:
- Last click gives 100% of credit to the final ad click before conversion.
- Data-driven attribution (DDA) splits credit across multiple ad interactions based on account path data.
- A switch can change CPA, ROAS, conversion counts, and conversion value in Google Ads reports.
- It can also change Smart Bidding signals, because bidding uses the attribution model tied to the conversion action.
- DDA tends to fit multi-touch, higher-volume accounts using advanced PPC tools with clean tracking.
- Last click tends to fit low-volume or short-path accounts where simplicity matters more.
- Neither model proves causation. If you want to know what drove lift, I’d look at CRM data, offline revenue, margin, payback, and incrementality tests.
If you manage PPC budgets, the main question is simple: which model gives you the least-wrong signal for budget and bidding decisions?
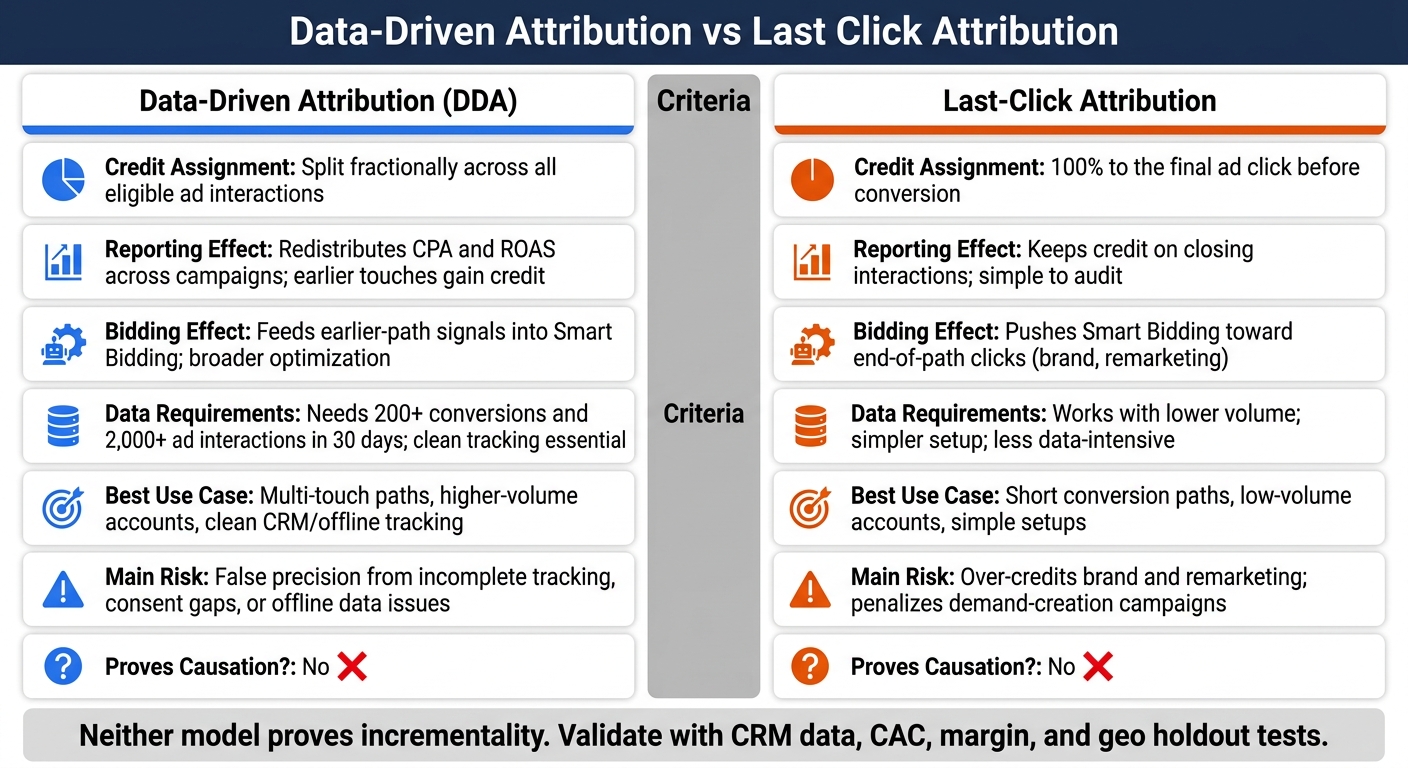
Data-Driven Attribution vs Last Click: Side-by-Side PPC Comparison
Google Ads Attribution: Last Click vs. Data-Driven Explained
sbb-itb-89b8f36
Quick Comparison
| Criteria | Data-Driven Attribution | Last Click |
|---|---|---|
| Credit assignment | Split across touches | All credit to final click |
| Reporting effect | Moves CPA and ROAS across campaigns | Keeps credit on closers |
| Bidding effect | Feeds earlier-path signals into Smart Bidding | Pushes bidding toward end-of-path clicks |
| Best use case | Multi-touch paths, enough data, clean tracking, or support from top PPC agencies | Short paths, lower volume, simple setup |
| Main risk | Fractional credit built on partial tracking | Over-crediting brand and remarketing |
| Business truth? | No | No |
I’d use DDA to read path contribution and last click as a simple control view. You can also audit your setup using PPC advertising tools Then I’d check both against pipeline, CAC, margin, and payback before moving budget.
How Each Model Assigns Conversion Credit
Data-Driven Attribution: Fractional Credit Across the Path
DDA uses the converting and non-converting paths in your account to assign credit in a way that lines up more closely with PPC reporting. Instead of giving all credit to one click, it splits credit based on your account data. That model can factor in click order, device, timing, and path length. So yes, DDA can change how campaigns rank on paper even before you touch budget.
For DDA to work well, tracking needs to be clean. Offline imports should stay consistent, duplicate events need to be removed, and conversion windows should match the buying cycle. Google’s volume thresholds are 200 conversions and 2,000 ad interactions in 30 days, with some conversion actions needing 300 conversions and 3,000 ad interactions.
Last-Click Attribution: Full Credit to the Final Ad
Last-click attribution gives 100% of the conversion credit to the final eligible ad click before the conversion. Every earlier click gets zero.
That makes last click simple to audit. You can see what got credit without much debate. But that same simplicity can skew the story. Brand and remarketing often get too much credit, while earlier campaigns that introduced or warmed up the buyer get none. That matters a lot when you switch models and your reporting starts to move around.
A Hypothetical Multi-Touch Path Showing How Credit Moves
Take a one-week customer path. On Monday, someone clicks a nonbranded search ad for "project management software." On Thursday, they click a product comparison ad. On Saturday, they click a branded search ad and complete a $1,200 purchase.
Under last click, the branded campaign gets the full $1,200. Under DDA, credit is split across the nonbrand, comparison, and branded touches. The exact DDA split depends on the converting and non-converting paths in your account.
| Criterion | Data-Driven Attribution | Last-Click Attribution |
|---|---|---|
| Credit allocation | Fractional credit based on modeled contribution across eligible interactions. | 100% to the final eligible ad click. |
| Required data | Sufficient, clean conversion-path data; tracking quality and volume affect usefulness. | Identifying the final eligible click and conversion; simpler and less data-intensive. |
| Earlier interactions | Can receive partial credit when the model estimates that they contributed to conversion likelihood. | Receive no credit if they are not the final ad interaction. |
| Interpretability | More nuanced but less immediately transparent because fractional values come from a statistical model. | Highly transparent and easy to audit: the final click gets all credit. |
| Best fit | Evaluating prospecting, consideration, brand, and cross-campaign contributions; informing value-based optimization when data is adequate. | Simple reporting, low-volume accounts, short conversion paths, or a baseline for comparison when modeled attribution is unavailable. |
That shift in credit is what changes reported conversions, conversion value, CPA, and ROAS. And that’s where the reporting and bidding impact starts to show up, often requiring advanced PPC optimization tools to manage the shift.
How Reporting Changes After Switching Attribution Models
What Changes in Conversion, Value, CPA, and ROAS Reports
Switching to DDA changes how credit is assigned, not how many conversions actually happened. That sounds small, but it can reshape what you see in reports. CPA, ROAS, and campaign performance can all move across campaigns, ad groups, keywords, and audiences. And this matters for another reason: the same attribution model also changes the signals that bidding uses.
Here’s what changes in reporting:
| Reporting field | Last-click view | DDA view |
|---|---|---|
| Conversion count | Full credit to the final eligible interaction | Distributed across contributing interactions |
| Conversion value | Full value assigned to the final interaction | Apportioned by estimated contribution |
| CPA | Cost ÷ last-click conversions | Cost ÷ DDA-attributed conversions |
| ROAS | Last-click value ÷ cost | DDA-attributed value ÷ cost |
| Assisting interactions | No conversion credit in primary columns | Can receive fractional credit |
A simple example makes this easier to see. If a campaign spent $12,000 and had 100 last-click conversions, its CPA would be $120. If DDA gives that same campaign 126.32 conversion credits, the reported CPA drops to about $95 - even though spend and actual customer volume did not change. On the flip side, a campaign that loses closing credit will show a higher CPA and lower ROAS after the switch.
Why Historical Comparisons Can Break
A model switch creates a break in measurement. Before you switch, export a baseline report and note the switch date. If you compare performance across that line, you are not looking at like-for-like data. Historical data may be shown under the new model, which can make the old view hard to recreate.
That’s why it helps to check Google Ads' Model comparison report before changing budgets. You can compare last-click and DDA CPA and ROAS for the same past activity and see how far the numbers move. If the baseline shifts, budget calls can get shaky fast.
Using Google Ads automation tools can help manage these shifts in performance data. Those reporting changes then flow into bidding behavior, which is the next piece.
Bidding Impact and Where Each Model Helps or Misleads
How Attribution Affects Smart Bidding Signals
Attribution changes the conversion signal that Smart Bidding learns from. In Google Ads, the attribution setting on a conversion action affects bid strategies that use the Conversions column.
With DDA, credit is split across eligible interactions. That gives Smart Bidding a broader read on the earlier and assisting touches that show up before a conversion. Last click does the opposite - it gives all credit to the final click, which pushes optimization toward closing interactions like brand and remarketing.
That said, attributed conversions are not the same as business results. The target should be qualified leads, offline revenue, margin, and payback - not attributed volume by itself. Change the model, and you change the budget bias, the bidding signal, and the way things can go wrong.
| Dimension | Data-driven attribution | Last-click attribution |
|---|---|---|
| Signal distribution | Fractional credit across eligible interactions based on account data, focused on bidding impact. | 100% of credit to the final ad click before conversion. |
| Likely budget bias | Can show value in earlier or assisting interactions that last click tends to miss. | Favors brand, remarketing, and other late-stage closing interactions. |
| Suitability for Smart Bidding | Works with Smart Bidding when tracking is reliable and volume is adequate. | Simple and still supported, but the signal is narrower and pushed to the end of the path. |
| Data requirements | Needs enough clean conversion-path data for steady bidding signals. | Easier to use in lower-volume accounts, but it does not fix missing assist credit. |
| Main failure mode | Can create false precision when tracking, consent, conversion definitions, or offline data are incomplete. | Can over-credit the final click and lead teams to cut demand-creation activity that helped drive the conversion. |
That same split in credit also changes which campaigns Smart Bidding tends to favor.
When DDA Works Better and When Last Click Is More Reliable
DDA tends to work better in higher-volume, multi-touch accounts. Last click is often more dependable when paths are short, intent is high, and account volume is low.
For B2B, import MQLs, SQLs, opportunities, closed-won revenue, or gross profit through offline conversions. Then compare both models against pipeline.
How Both Models Can Mislead Decisions
Both models are limited by what they can see. If consent signals are missing, GCLID capture is broken, cross-device activity is missed, phone calls are not tracked, or offline stages never make it back into the platform, the path can look much shorter than it was. In that setup, DDA can produce a polished-looking fractional split from incomplete data, while last click gives all remaining credit to the final observable interaction.
Neither model proves incrementality. A brand ad that gets last-click credit may have picked up a user who was already ready to buy. An assisting generic ad that gets DDA credit may show up in many conversion paths without causing any of them.
Test incrementality with geo holdouts, experiments, and lift studies - not attribution columns.
Those limits matter when you choose a model in the decision framework below.
Decision Framework and Conclusion
A Step-by-Step Selection Process for PPC Teams and Portfolio Operators
Use the limits above to pick the model for each conversion action, not as one account-wide default.
Start with the conversion action and the business decision behind it. Split primary business outcomes - like closed-won revenue, qualified pipeline, subscription activation, or profitable purchases - from supporting actions like form submissions, phone calls, add-to-cart events, or demo requests. A form fill is not the same as a sales-qualified opportunity, so they may need different models. Set attribution by conversion action instead of using one blanket setting.
Audit tracking first. Then check current DDA eligibility in the account, because volume thresholds change.
Next, look at conversion volume and path length. Run a 30-90 day comparison, or long enough to cover the full sales cycle, and don't change budgets, bids, or conversion definitions during that window. Compare more than platform CPA and ROAS. Look at qualified-lead rate, opportunity rate, close rate, revenue, and payback too. A campaign may lose platform credit under last click and still bring in better customers in the CRM. Write down the model, the reason for using it, the start date, and the triggers for review.
Conclusion: Use Attribution to Inform Decisions, Not Replace Business Truth
After the test period, pick the model that lines up best with CRM outcomes, not just platform CPA or ROAS.
Use DDA when conversions usually involve multiple paid touches and the data is clean. Use last click when paths are short, volume is low, or you need the final measurable touch.
Neither model proves that advertising caused a conversion. Attribution shows how recorded credit gets assigned - not whether the spend was incremental. Check budget decisions against CRM outcomes, gross margin, CAC, and payback. For high-spend decisions, run geo holdouts or lift studies.
Finding PPC Tools and Agencies for Attribution and CAC Efficiency
If you need outside help with attribution setup or CAC analysis, use a vetted directory. Top PPC Marketing Directory lists PPC tools and agencies for attribution, CRM integration, and CAC efficiency, including a section for mid-market and PE-backed companies focused on paid performance measured by pipeline and payback, not clicks.
FAQs
Should I switch from last click to DDA?
Yes - if your account has enough conversion volume for machine learning, which usually means 300-500 conversions per month.
DDA tends to work better for complex, multi-channel journeys because it assigns credit based on actual influence, not fixed rules.
If your volume is lower, a position-based model is often the safer pick. Before you switch, make sure your CRM and GA4 data are clean and lined up. It also helps to validate DDA with incrementality tests before moving major budget.
Will changing attribution affect Smart Bidding?
Yes. Smart Bidding uses the conversion signals and credit from your current attribution model.
If you switch models, your bid targets can shift. That can lead to short-term swings in performance.
To keep bidding more stable, adjust targets like Target CPA or ROAS based on the change shown in Cost/conv. (current model).
How do I know which model fits my account?
Choose your attribution model based on conversion volume and business goals.
Data-Driven Attribution tends to work best when you have a strong dataset - usually around 300 to 500 conversions per month.
If you're below that range, results may be less steady. In that case, a position-based model can do a better job of balancing lead generation with final conversions.
If you have fewer than 300 monthly conversions, simpler models like last-click are often more dependable.
The main idea is simple: match the model to your sales cycle and the complexity of your customer journey.