I’d start with Google Search when buyers already search for your solution, and test LinkedIn when you need to reach target accounts and buying roles before they search. I’d increase spend only when added opportunities meet your acquisition-cost and payback targets.
Cheap leads aren’t the goal. Qualified pipeline is. I compare reach, costs, lead quality, sales-cycle timing, and scale limits - using the same CRM stages and attribution rules.
Quick Comparison
| Criterion | Google Ads | LinkedIn Ads |
|---|---|---|
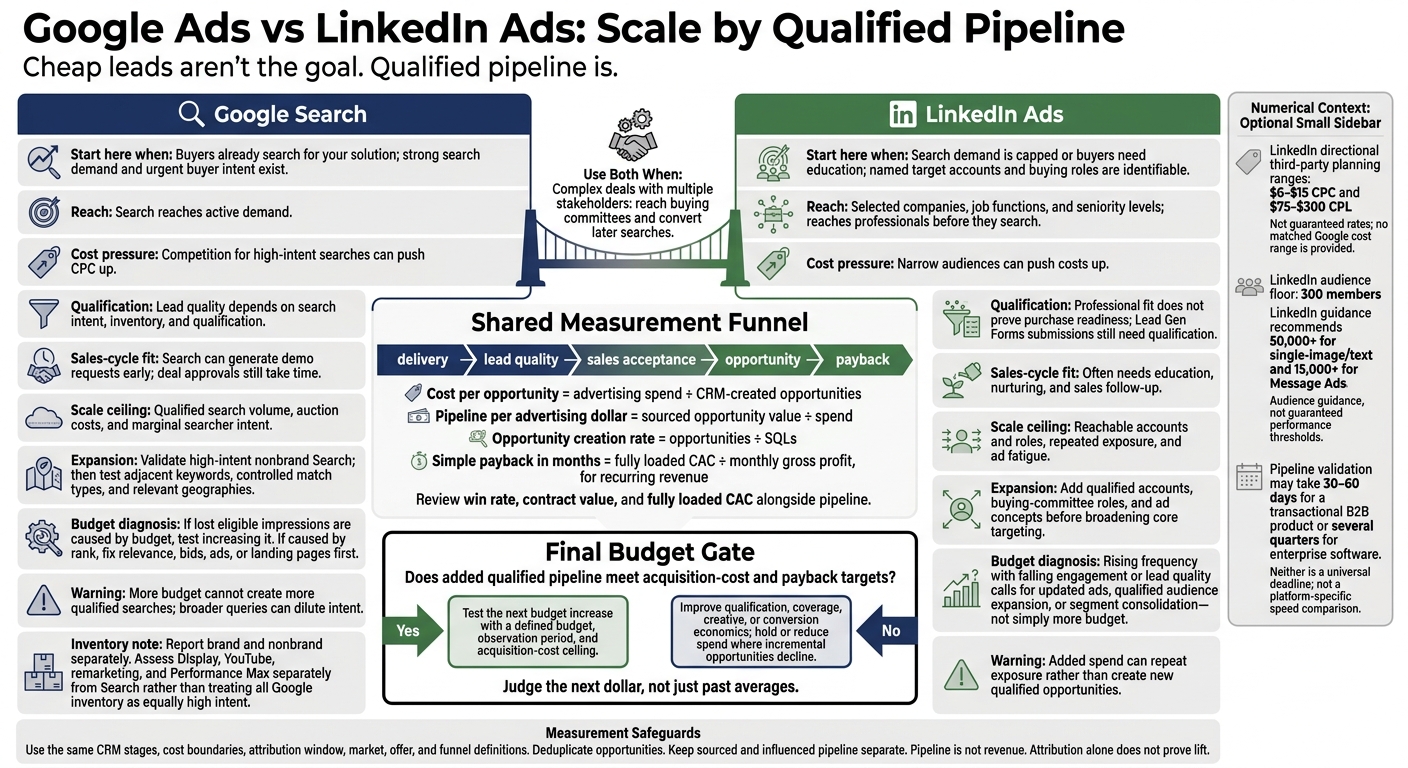
| Buyer reach | Search reaches active demand; Display and Performance Max add coverage | Reaches selected companies, job functions, and seniority levels |
| Cost pressure | Competition for high-intent searches can push CPC up | Narrow audiences can push costs up; cited planning ranges are $6–$15 CPC and $75–$300 CPL, not guaranteed rates |
| Lead quality | Depends on search intent, inventory, and qualification | Professional fit does not prove purchase readiness |
| Sales-cycle fit | Search can generate demo requests early; deal approvals still take time | Often needs education, nurturing, and sales follow-up |
| Scale limit | Qualified search volume and auction costs | Reachable accounts, repeated exposure, and ad fatigue |
| Budget test | Add query coverage and assess other inventory separately | Add qualified accounts, roles, and ad concepts |
My rule: <u>judge the next dollar, not just past averages</u>. Track sales acceptance, cost per opportunity, win rate, and fully loaded CAC. Use both platforms when account outreach and later searches work together - and choose top PPC tools or PPC agencies that can connect spend to CRM outcomes.
Google Ads vs LinkedIn Ads: Scale by Qualified Pipeline
Google Ads vs LinkedIn Ads for B2B SaaS (+ Reddit Ads) | OneMetrik
sbb-itb-89b8f36
LinkedIn Ads: Reach B2B Buyers
When Search demand flattens, LinkedIn can add scale by reaching more target accounts and roles. Build audiences with ICP filters and named-account lists, but avoid stacking too many filters. Tight combinations shrink reach.
Professional Targeting for Enterprise Sales
Use Sponsored Content to educate buyers, Lead Gen Forms to collect leads with less friction, and Conversation Ads for CTA-driven outreach. Less friction does not mean qualified leads. Lead Gen Forms submissions still need qualification.
Pair account lists with role filters so executives, evaluators, and users get different messages. This approach fits unfamiliar categories and high-value offers where buyers need education before requesting a demo.
LinkedIn Ads: Strengths and Scale Limits
LinkedIn scale depends on audience breadth, not just budget.
| Dimension | Advantages | Disadvantages and scale limits |
|---|---|---|
| Professional targeting | Combines account and role targeting to reach more of the right buyers. | Member data and differences in job titles can leave coverage gaps. |
| Audience relevance | Reaches more members of buying committees. | Professional fit does not establish intent, budget, authority, or purchase readiness. |
| Reach | Reaches professionals before they search. | Qualified reach is finite within selected industries, geographies, accounts, and roles. |
| Cost | High-value opportunities can justify higher lead costs. | Narrow audiences can increase CPC and CPL. Directional PPC marketing directory planning ranges are $6–$15 CPC and $75–$300 CPL, not guaranteed rates. |
| Sales-cycle fit | Fits education, ABM, retargeting, and long sales cycles. | More leads may need more nurturing, qualification, and sales follow-up before producing pipeline. |
| Saturation risk | Reach, frequency, and engagement help identify fatigue. | More budget can mean repeat exposure rather than new qualified reach. |
Check delivery and qualification separately before increasing spend. If frequency climbs while engagement falls, change the ad content or test adjacent roles and accounts. If CPL stays low but sales acceptance falls, tighten targeting or change the offer. Send outcomes to CRM and judge scale by qualified opportunities and pipeline per dollar, checking that CPL and pipeline quality hold as spend grows.
Google Ads vs LinkedIn Ads: Costs and Scale
Compare qualified search demand with coverage of qualified professional audiences. Report Google Search, other Google inventory such as Display, YouTube, and remarketing, and LinkedIn separately. Test scale through unit economics, not raw volume.
The comparison below separates cost pressure from pipeline output.
| Dimension | Google Ads | LinkedIn Ads |
|---|---|---|
| Reach | Search reaches people who express demand; other Google inventory adds lower-intent reach. | Targets professionals by firmographic and job attributes. |
| CPC pressure | CPCs climb as advertisers compete for a limited set of commercial queries. | Narrow professional audiences and limited inventory can make each click expensive. |
| Lead quality | Lead quality determines cost per opportunity, not just CPL. | Lead quality determines cost per opportunity, not just CPL. |
| Scale ceiling | Qualified query volume, auction competition, and marginal searcher intent limit Search expansion. Assess other inventory separately. | Reachable accounts and roles, frequency, ad fatigue, and retargeting pools limit audience expansion. |
Compare Costs and Qualified Pipeline
CPC and CPL are inputs, not the verdict. Judge performance by sales acceptance, opportunity creation, contract value, close rate, and payback - not CPC or CPL alone.
| Measure | Google Ads | LinkedIn Ads |
|---|---|---|
| CPC | Shows the price of competing for queries. Separate brand from nonbrand. | Shows the price of reaching the selected professional audience. |
| CPL | Review alongside query quality and landing-page conversion rate. | Review alongside offer type and lead-form qualification. |
| Sales acceptance | Check whether rejected leads came from weak queries or poor qualification. | Check whether rejected leads failed company, role, or qualification criteria. |
| Cost per opportunity | Advertising spend ÷ CRM-created opportunities, using consistent attribution rules. | Use the same calculation. Deduplicate contacts and accounts attached to one opportunity. |
| Pipeline per advertising dollar | Sourced opportunity value ÷ spend. Report influenced pipeline separately. | Apply the same rules. Do not credit the full opportunity value to every stakeholder interaction. |
Connect campaigns to CRM stages and import qualified outcomes back into Google Ads. Pipeline is not revenue. Review it alongside win rate, contract value, and payback. Compare equivalent offers and funnel stages, rather than a Search demo request against a LinkedIn guide download.
Once cost efficiency is clear, test how long each channel takes to produce pipeline.
Compare Measurement Speed and Scale Limits
Track delivery → lead quality → sales acceptance → opportunity → payback. Review tracking and pacing first, sales acceptance after lead review, and revenue after a representative sales cycle. Pipeline validation may take 30-60 days for a transactional B2B product or several quarters for enterprise software. Neither is a universal deadline.
| Check | Google Search | LinkedIn Ads |
|---|---|---|
| Early signals | Query relevance, impression share, conversion rate, and qualified-lead rate. | Reach, frequency, clicks, form completions, and conversion rate. |
| Pipeline validation window | Form submissions can arrive quickly; opportunities and revenue take longer. | Allow time for nurturing and buying-group activity to reach CRM stages. |
| Qualified-demand limits | More budget cannot create more qualified searches. | LinkedIn scale depends on reachable buyer coverage, not search volume. |
| Audience limits | Evaluate non-Search inventory separately when expanding beyond queries. | Check whether added spend reaches new qualified accounts or repeats existing exposure. |
| Saturation indicators | Declining impression share, rising CPC, a broader query mix, weaker incremental conversion rates, and more low-quality search terms. | Rising frequency, falling CTR, repeated exposure to the same accounts, and shrinking reach across distinct users. |
Compare matched cohorts using the same attribution window, market, and offer. Use these saturation signals to guide the next budget increase, allocating spend by marginal qualified pipeline per dollar, not historical averages.
How to Increase B2B Ad Budgets
Scale only where additional qualified pipeline still meets payback requirements. Tie each budget increase to a defined test, not a fixed platform split. Before launch, set the test budget, observation period, and acquisition-cost ceiling.
Use these gates to decide whether the next dollar should expand search or audience coverage.
| Platform | Trigger | Action | Risk |
|---|---|---|---|
| Google Ads | High-intent nonbrand Search produces sales-accepted leads or opportunities | Test adjacent keywords, controlled match types, relevant geographies, remarketing, and other Google inventory | Broader queries can dilute intent and waste spend |
| Google Ads | Lost eligible impressions limit coverage | If budget causes the loss, increase it; if rank causes it, fix relevance, bids, ads, or landing pages first | Demand ceilings and auction inflation can reduce marginal value; more budget cannot fix weak relevance |
| LinkedIn Ads | A sufficiently large ICP audience produces sales-accepted leads | Add accounts, buying-committee roles, ad concepts, and controlled segment variations | Fragmentation and overlap weaken learning |
| LinkedIn Ads | Frequency rises while engagement or lead quality declines | Update ad content, adjust placements, consolidate segments, and add qualified audiences; hold or reduce budget if incremental opportunities decline | Added spend repeats exposure rather than creating opportunities |
Google Ads: Expand Qualified Search Coverage
Start with Search when intent already exists and coverage is the constraint, not demand creation. Validate high-intent nonbrand Search first. Report brand, nonbrand, competitor, and problem-based demand separately. Once branded and nonbrand Search are stable, expand into adjacent queries first.
Diagnose impression loss before adding budget. For Maximize Conversions and Maximize Conversion Value, review Google’s budget simulator before increasing spend rather than relying on Search Lost IS (budget) alone.
Test controlled match types, relevant geographies, remarketing, and other Google inventory only after the existing search-term base is healthy. Where appropriate, use negative keywords to exclude research-only, employment, free, support, or unrelated queries. Import qualified CRM outcomes into bidding, and use Maximize Conversion Value only when reliable business values are available.
LinkedIn Ads: Expand Qualified Audience Coverage
Use LinkedIn when search demand is capped and you need more coverage across accounts and roles. Define the ICP by company size, industry, geography, job functions, seniority, relevant skills, and buying-committee roles. LinkedIn’s audience floor is 300 members; its guidance recommends 50,000+ for single-image/text ads and 15,000+ for Message Ads. Test professional attributes and account-list segments separately. Add new roles, accounts, and ad concepts before broadening core targeting.
Compare Lead Gen Forms and landing pages with the same audience and offer. Submissions measure delivery, not readiness to scale. Gate budget increases on sales acceptance and opportunity creation.
Use frequency and engagement to decide whether to expand coverage or update ads. When frequency rises before opportunity volume does, expand audience coverage rather than budget alone. If exposure grows without new opportunities, update ad content, adjust placements, consolidate segments, or add qualified accounts. Use retargeting only when audience size and relevance support it.
Choose Platforms by Pipeline Results
When cost and scale look similar on paper, choose the platform that delivers more qualified pipeline at the right payback.
| Business condition | Platform choice | Economic rationale |
|---|---|---|
| Strong search demand and urgent buyer intent | Google Ads | Converts existing demand into leads fast |
| Limited category search volume but named B2B accounts and buying roles | LinkedIn Ads | Reaches buyers before search intent appears |
| Complex deals with multiple stakeholders | LinkedIn Ads + Google Ads | Reaches buying committees and converts later searches |
| Google generates volume but weak qualification or low close rates | LinkedIn Ads test or budget shift | More precise professional targeting may improve lead quality despite higher CPL |
| Strong measurement, CRM integration, and enough conversion volume on both platforms | Both | Combines demand creation and conversion of existing demand |
Test these choices with the same funnel definitions on both platforms.
Track Acquisition Costs, Pipeline, and Payback
Use one shared funnel definition. Track cost per SQL, opportunity creation rate, pipeline per advertising dollar, win rate, ACV, and payback. Opportunity creation rate = opportunities ÷ SQLs. Compare cohorts only after their sales cycles have had time to mature.
Keep first-touch, lead-creation, opportunity-creation, and revenue-influence reports separate. Do not mix influenced pipeline with sourced pipeline. Use CRM IDs to link contacts, buying roles, accounts, and opportunities. Where possible, measure engaged contacts and buying-role coverage, but count each opportunity’s value only once.
Use account or geographic holdouts to test incremental contribution. Attribution alone does not prove lift.
Separate media-only CAC from fully loaded CAC. Fully loaded CAC includes agency, creative, technology, labor, and sales-development costs. Apply the same cost boundaries across platforms and portfolio companies. For recurring revenue, simple payback in months = fully loaded CAC ÷ monthly gross profit.
Once the numbers are clean, choose execution partners that can support your measurement model.
Find PPC Tools and Agencies
The Top PPC Marketing Directory lists PPC tools and agencies for teams working to improve paid performance and CAC efficiency, including mid-market and PE-backed companies. Evaluate providers on CRM integration, attribution, pipeline reporting, and payback measurement.
Conclusion: Allocate Budget by Pipeline and Payback
Allocate incremental budget where qualified pipeline, CAC, and payback meet your business requirements - not where clicks cost least.
FAQs
How much budget do I need for a meaningful channel test?
Set aside 10-20% of your total PPC budget for the test period. If you’re starting from scratch, keep tests focused so you don’t spread your learning too thin.
For testing across platforms, consider a 70-20-10 split, with 20% for optimization tests and 10% for new experiments. Give tests enough time to collect usable data - about 2 weeks for LinkedIn variations, for example.
How can I tell whether LinkedIn drives later Google conversions?
Use cross-channel attribution to track the full B2B journey, rather than relying on native platform reports or last-click metrics. Connect LinkedIn Conversions API with HubSpot to sync online and offline data. This helps you see whether contacts who convert through Google search previously interacted with LinkedIn content.
Use GA4 to analyze multi-channel paths. For deeper analysis, Power BI or Tableau can combine PPC, CRM, and finance data to calculate payback and attribution across the funnel.
How should I scale ads with limited CRM conversion data?
Start with CPC bidding to build traffic and learn about your audience when historical data is limited. Group budgets into fewer, larger campaigns to reach learning-phase conversion thresholds faster - typically 15–20 conversions per week on LinkedIn.
Use manual bidding to keep control during testing. Increase budgets gradually by 10–20% to avoid recalibration. Connect CRM data to track down-funnel metrics and refine targeting, even when conversion volume is low.