If you want attribution that makes sense across Google Ads, Meta, LinkedIn, GA4, and your CRM, I’d start with one clean dataset, one time window, and one simple Python model. That gets you from messy platform reports to one channel-level view of pipeline or revenue. For teams without internal data resources, specialized PPC agencies can often handle this technical setup.
Here’s the short version:
- I treat attribution as a way to split conversion or revenue credit across touchpoints before a sale.
- I use Python to put data from different platforms into one format and apply the same rules to every path.
- I start with 4 fields: user ID, channel, timestamp, and conversion flag.
- I clean timestamps, standardize channel names, remove duplicates, and sort events by user and time.
- I usually compare first-touch, last-touch, and linear first.
- I only change spend when model shifts are clear, usually more than 10% to 15%, and the pattern holds for a full sales cycle.
A simple example shows why this matters. If someone touches Meta, LinkedIn, and then branded search before a demo request, last-touch gives 100% of the credit to search. A linear model splits credit across all touches. That can change where your next $10,000 to $100,000+ in budget goes.
What I like about this approach is that it stays plain: clean the data, rebuild the path, apply one rule, total credit by channel, and export the result to your cross-platform ad performance tracking tools. That is enough to spot whether lower-funnel channels are getting too much credit.
If I were starting today, on 08/15/2026, I’d keep the first pass narrow, use pandas, and make sure every assumption is written down before adding more model logic.
Core Terms and Basic Models
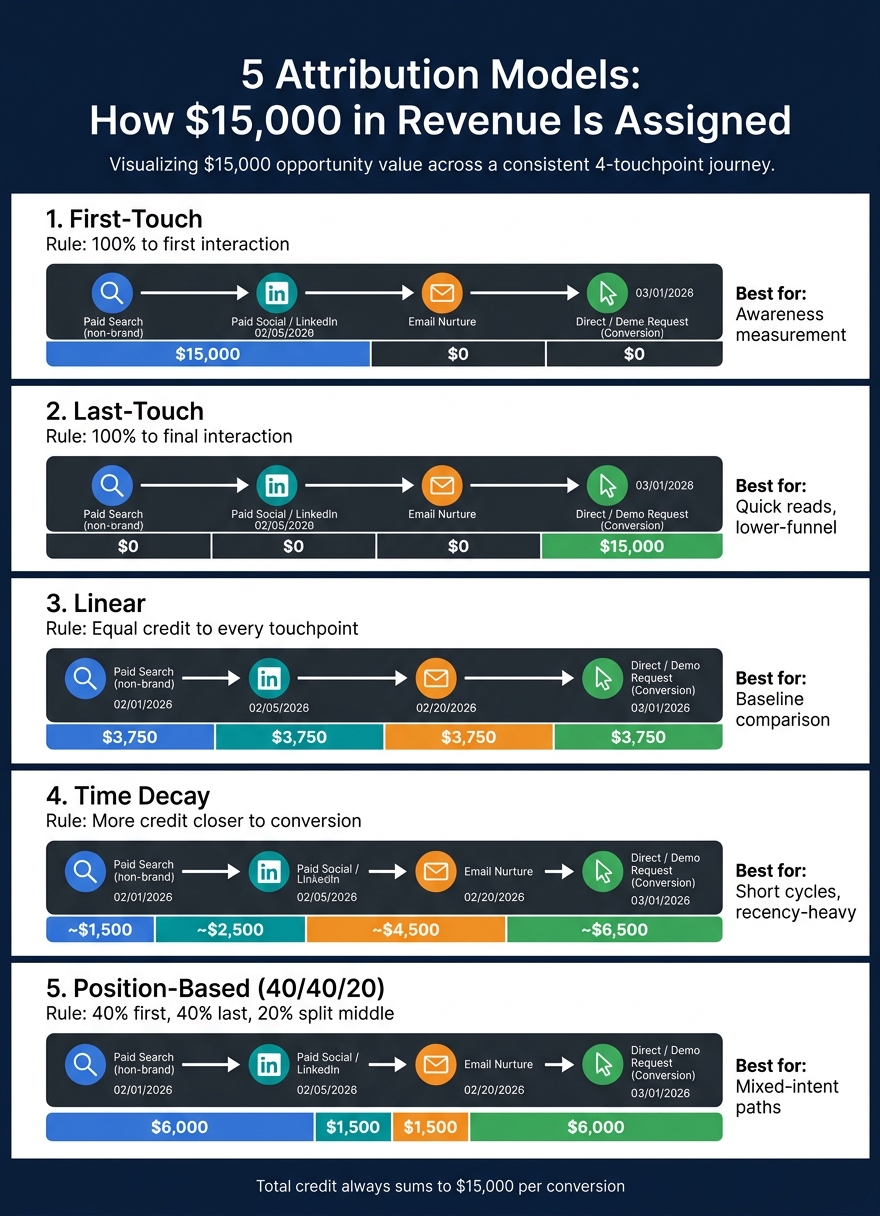
5 Attribution Models Compared: How $15,000 in Revenue Gets Assigned
Touchpoints, Conversion Paths, Windows, and Channel Credit
Before you write a single line of Python, lock down four terms. Everything else in this guide depends on them.
A touchpoint is any time-stamped interaction with a marketing asset - like a Google Ads click, an email click, or a landing page visit. A conversion path is the ordered series of touchpoints for one user or account, starting with the first interaction and ending in a conversion like a demo request, opportunity creation, or revenue. In Python, touchpoints become rows in a DataFrame. Conversion paths are what you get when you group those rows by user ID and sort them by time.
A conversion window is the time range you set to decide which touchpoints count for a given conversion. A 30-day window often fits MQLs. A 60- to 90-day window is usually a better fit for closed-won revenue. For example, if the conversion date is 03/01/2026 and the window is 60 days, only touchpoints from 01/01/2026 forward are included - anything earlier is out. Set the window too short, and you'll miss early discovery channels like non-brand paid search. Set it too long, and you may hand credit to touches that didn't do much.
Channel credit is the share of conversion value assigned to each channel. For one conversion, total credit must always add up to the full amount, such as a $15,000 opportunity. Before you build paths, standardize timestamps and channel names in Python, or use paid media optimization platforms to audit your data first. Data exports from Google Ads, Meta, and your CRM often use different formats and naming rules, and those mismatches can skew both your windows and your channel totals.
These definitions shape how Python turns raw platform data into paths and assigns credit. Once they're set, the model choices below are much easier to compare.
First-Touch, Last-Touch, Linear, Time Decay, and Position-Based Models
Each attribution model is just a rule for splitting a dollar amount across the touchpoints in a conversion path. Here's a concrete B2B SaaS example with a $15,000 opportunity value and this path:
- 02/01/2026 - Paid Search (non-brand) click
- 02/05/2026 - Paid Social (LinkedIn ad) click
- 02/20/2026 - Email nurture click
- 03/01/2026 - Direct visit and demo request (conversion)
Here’s how each model assigns that $15,000:
| Model | Credit Rule | $15,000 Example Result |
|---|---|---|
| First-touch | 100% to the first interaction | Paid Search gets $15,000 |
| Last-touch | 100% to the final interaction | Direct gets $15,000 |
| Linear | Equal credit to every touchpoint | $3,750 to each of the 4 channels |
| Time decay | More credit to touches closer to conversion | Email and Direct get the largest shares; Paid Search gets the least |
| Position-based (40/40/20) | 40% to first, 40% to last, 20% split across middle touches | Paid Search and Direct each get $6,000; Paid Social and Email split $3,000 ($1,500 each) |
First-touch tells you which channels start the journey. Last-touch shows which ones finish it. Linear gives you a simple equal-credit baseline. Time decay fits shorter sales cycles or recency-heavy campaigns. Position-based makes sense when both the first and last touch carry weight.
Start with first-touch, last-touch, and linear. Then add time decay or position-based as comparison models.
Next, map these rules to a clean dataset in Python.
sbb-itb-89b8f36
Prepare the Minimum Dataset for Python
Required Fields and Optional Fields
A basic attribution workflow starts with four fields: user ID, channel, timestamp, and conversion flag. Those four fields turn raw platform exports into comparable conversion paths. They’re enough to run first-touch, last-touch, and linear models.
| Field | Status | Purpose |
|---|---|---|
| User ID / cookie ID | Required | Links touchpoints into one journey per person |
| Channel | Required | Assigns credit to paid search, social, email, and other sources |
| Timestamp | Required | Orders touchpoints into a conversion path |
| Conversion flag / event | Required | Marks which path ended in a conversion |
| Campaign | Optional | Breaks channel performance into campaign-level detail |
| Source / medium | Optional | Breaks traffic into more specific sources |
| Revenue | Optional | Supports value-based attribution to move from conversion counts to revenue |
| Opportunity stage | Optional | Useful for pipeline attribution |
| Device | Optional | Helps identify cross-device behavior patterns |
Start with the four required fields. Get your first model running cleanly. Then add optional fields like revenue and opportunity stage.
Cleaning Steps Before Path Building
Raw exports from top PPC advertising tools and your CRM usually aren’t ready for Python out of the box. You need four cleanup steps to build usable paths and keep channel credit consistent.
Normalize timestamps first. Convert every timestamp to one time zone and one format - MM/DD/YYYY HH:MM works well for U.S. reporting. If timestamps don’t line up, your conversion windows won’t either.
Standardize channel names and casing. Use .str.lower(), then map each variation to one fixed label. For example, "paid search", "PPC", and "SEM" should all become "Paid Search". If you skip this, one channel gets split into several buckets, and your credit totals come out wrong.
Remove duplicate touch events. Deduplicate using the combination of user ID, timestamp, channel, campaign, and event type when those fields define one touchpoint. Keep one row for identical user, time, channel, and event combinations unless those duplicates are valid.
Group by user ID before modeling. Sort each user’s rows by timestamp, then group them by user ID so you can rebuild each journey in order.
Once the rows are clean and grouped, you can start applying attribution rules in Python. After that, the job becomes path-by-path credit assignment.
Build a Simple Python Attribution Workflow
Using the cleaned dataset, you can build this workflow in five pandas steps.
Steps 1 to 3: Load Data, Rebuild Journeys, and Flag Conversions
Start by loading your cleaned export into a pandas DataFrame with pd.read_csv(). Parse timestamps with pd.to_datetime() using a U.S. format like MM/DD/YYYY HH:MM:SS, and cast revenue to numeric USD values.
df["event_timestamp"] = pd.to_datetime(df["event_timestamp"], format="%m/%d/%Y %H:%M:%S", errors="coerce")
df["conversion_value"] = pd.to_numeric(df["conversion_value"], errors="coerce")
From there, sort and group the data so each user's journey is rebuilt in the right order:
paths = (df
    .sort_values(["user_id", "event_timestamp"])
    .groupby("user_id")["channel"]
    .apply(list)
    .reset_index(name="conversion_path"))
That gives you one ordered path per user, such as ["Paid Search", "Paid Social", "Direct"].
Next, flag conversions. Add a boolean column, then split converting and non-converting journeys early so the model only works with the paths you want:
df["is_conversion"] = df["event_type"].isin(["purchase", "opportunity_created"])

journeys = (df
    .sort_values(["user_id", "event_timestamp"])
    .groupby("user_id")
    .agg({"channel": list, "is_conversion": "sum", "conversion_value": "sum"})
    .rename(columns={"channel": "conversion_path", "is_conversion": "conversion_count"}))

journeys["has_conversion"] = journeys["conversion_count"] > 0
converting = journeys[journeys["has_conversion"]]
Splitting converting and non-converting journeys at this stage keeps the model input clean.
Steps 4 to 5: Apply a Model and Total Credit by Channel
Once you have only converting journeys, start with a rule-based model. Linear attribution is a good place to begin because it spreads credit across every touchpoint instead of giving all of it to the start or end of the path.
One detail matters here: repeated channels in the same path. If a user touches the same channel more than once, you want to count each touchpoint before rolling the numbers up. The code below does that:
records = []
for _, row in converting.iterrows():
    n = len(row["conversion_path"])
    credit_per_touch = row["conversion_value"] / n
    for ch in row["conversion_path"]:
        records.append({"channel": ch, "credit": credit_per_touch})

linear_expanded = pd.DataFrame(records)
Then total the credit by channel:
channel_summary = (linear_expanded
    .groupby("channel")["credit"]
    .sum()
    .reset_index()
    .rename(columns={"credit": "attributed_revenue_usd"}))
First-touch and last-touch attribution use the same setup, but instead of splitting credit across the full path, they assign all credit to conversion_path[0] or conversion_path[-1].
What the Output Should Look Like
Your output should be a clean table with one row per channel and attributed revenue in USD. Export the result with channel_summary.to_csv("attribution_output.csv", index=False), then load it into your reporting tool. From there, you can compare models side by side in reporting tools.
Read Results and Use Them in Reporting
How to Compare Model Outputs Without Overreacting
Use the exported channel summary to compare models before you change spend. Treat differences between models as diagnostic output, not direct budget commands.
Last-touch tends to overweight lower-funnel channels. Multi-touch spreads credit across the full path. In practice, the best rule is simple: focus on changes in channel ranking, not tiny percentage swings. If a channel moves in a meaningful way under a position-based model and still remains below your CAC threshold, that's worth a closer look. One reporting period with a 5% shift in credit is not. For broader context on optimizing these shifts, consult a directory of PPC tools and strategies.
Use each model for the job it fits best:
- Last-touch for quick reads
- First-touch for awareness
- Linear as a baseline
- Time decay for recency-heavy journeys
- Position-based for mixed-intent paths
Only change budgets when a channel's credit share moves by more than 10% to 15% and that pattern holds across at least one full sales cycle.
Once you've matched the model to the question, send the same output into Looker, Tableau, or Power BI.
How Python Attribution Fits Into Cross-Platform Performance Reporting
The point of Python attribution isn't the table by itself. The point is where that table goes next.
Your Python output acts as a middle layer between raw exports from Google Ads, Meta, LinkedIn, and your CRM - and the BI dashboards your team reviews. Python rebuilds paths and assigns credit. Looker, Tableau, and Power BI then surface the results in a form people can use.
The reporting views that matter most connect attribution to business economics. Start with attributed CAC: divide total channel spend by attributed customers. Then map attributed conversion IDs to CRM opportunity IDs so you can show pipeline generated and closed-won revenue by channel.
From there, payback is pretty direct. Compare attributed CAC with average gross margin and expected monthly recurring revenue in USD to estimate months to payback.
Conclusion: Start Simple, Check Your Data, and Expand Carefully
The workflow here is intentionally basic: clean the data, rebuild journeys with pandas, apply a linear model, and export a channel-level credit table. That's enough to show meaningful differences between how channels perform and what last-touch reporting suggests.
Data quality matters more than model complexity. Start with clean inputs, add models only when journey volume can support them, and document every assumption.
FAQs
How do I choose the right attribution window?
Match your lookback period to your usual sales cycle. If customers tend to take 90 days to convert, a 30-day window will miss part of the path. For longer research phases, like travel, a 60- or 90-day window often makes more sense.
Check conversion paths to see how long people actually take to convert. Use the same windows across platforms so your numbers line up. Then revisit those settings as buyer behavior shifts. After you make changes, wait until your average conversion window has passed, and in most cases leave out the most recent 14 days.
What should I do if the same user appears across multiple platforms?
Use identity resolution so the same user isn't counted as separate people across platforms and devices. The best way to do that is with a persistent identifier, like a hashed email or a customer ID.
It also helps to use one consistent user ID, turn on cross-device tracking in your analytics platforms, and standardize UTMs across campaigns so your reporting stays consistent.
When should I move beyond first-touch, last-touch, and linear?
Move past first-touch, last-touch, and linear once your customer journey has three or more touchpoints. At that point, those models often miss what happens in the middle of the funnel.
If your sales cycle is longer than 90 days, or you want to avoid giving too much credit to bottom-funnel channels, use a more nuanced model. And once you hit 300 to 400 monthly conversions, it makes sense to look at algorithmic, data-driven attribution based on actual conversion patterns.