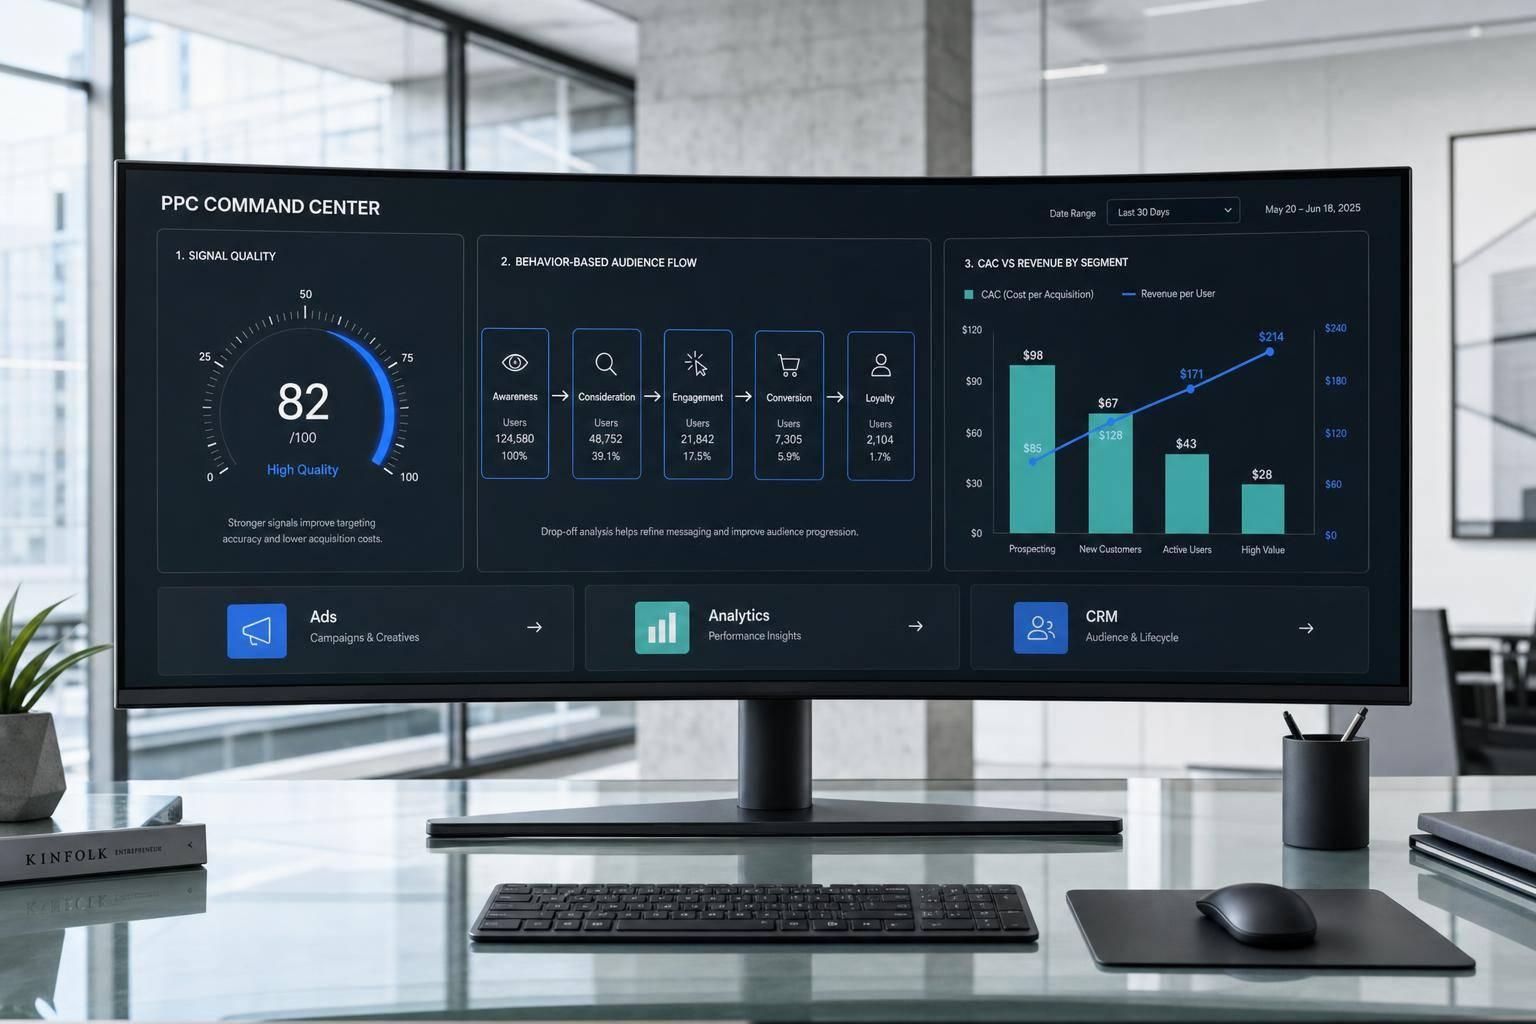
B2B PPC in 2026 comes down to three numbers: CAC, pipeline yield, and payback. If I were working with top PPC agencies to run paid media today, I would judge every channel by one test - does it turn spend into sales pipeline at a CAC the business can afford?
Here’s the short version:
- Median CAC payback is now 18 months
- Median new CAC ratio is $2.00 to get $1.00 of new ARR
- Healthy LTV:CAC still sits around 3:1 to 5:1
- Google Search and LinkedIn still fit higher-ACV offers best
- Review sites often bring stronger buying intent than many paid social programs
- Low CPL can be misleading if lead-to-SQL and SQL-to-opportunity rates are weak
What I take from this study is simple: cheap leads do not mean efficient growth. Costs are up, buyer journeys are long, and more searches end without a click. So I would not manage PPC using top PPC tools for CTR, MQL volume, or headline CPL alone.
Instead, I would look at:
- Fully loaded CAC
- Lead-to-SQL rate
- SQL-to-opportunity rate
- Pipeline created per dollar spent
- Months to payback
One point stands out. If payback is stretching past your target, adding spend usually makes the problem worse. In that case, I would fix funnel leakage and move budget toward sources with stronger buying intent before trying to scale.
This benchmark summary gives a clear way to pressure-test paid performance against what 2026 B2B teams are seeing in the market.
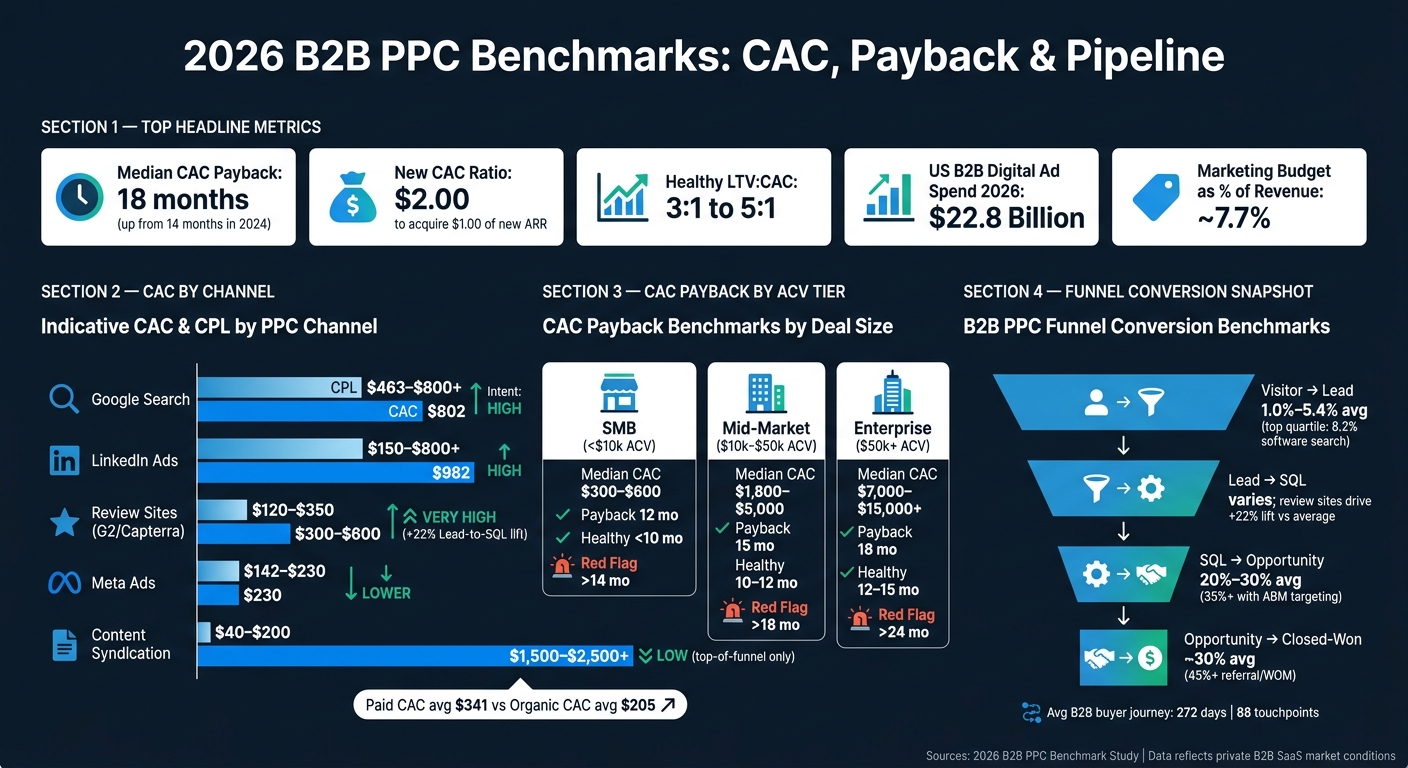
2026 B2B PPC Benchmarks: CAC, Payback & Pipeline by Channel
B2B SaaS Cost per Lead (CPL) Benchmarks 2026
sbb-itb-89b8f36
2026 Benchmark Overview: Business Goals, CAC, and Marketing-Sourced Pipeline
These benchmarks reflect a market that has moved away from hyper-growth and toward capital efficiency. Private-company growth has slowed to 26%. You can see that shift in higher acquisition costs and longer payback periods. U.S. B2B digital ad spend is forecast to reach about $22.8 billion in 2026, while marketing budgets have stayed at roughly 7.7% of revenue. At the same time, Google Ads CPCs have climbed 164% since 2019, and LinkedIn costs are up 89%.
Marketing-sourced pipeline is feeling that pressure too. The median private B2B SaaS company spends about 8% of ARR on marketing. Utilizing top PPC advertising tools still plays a big role, but it is no longer the main growth engine.
Benchmark ranges for CAC, payback, and LTV:CAC in B2B
CAC climbs fast as ACV increases and the sales motion gets more complex, so target setting needs to line up with the buyer, deal size, and payback profile. By segment, the benchmark ranges are:
| B2B SaaS Sub-Industry | Small Business CAC | Middle Market CAC | Enterprise CAC |
|---|---|---|---|
| Cybersecurity | $833 | $5,330 | $10,226 |
| Fintech | $1,461 | $4,923 | $14,774 |
| HR Tech | $440 | $1,912 | $6,793 |
| eCommerce SaaS | $299 | $1,407 | $2,206 |
| Medtech | $948 | $4,357 | $11,044 |
| Agtech | $634 | $1,830 | $6,951 |
Treat these ranges as an efficiency ceiling before you look at channel-level CAC and CPL.
Growth stage matters too. Median CAC rises from $1,248 at Seed to $2,105 at Series A, $3,842 at Series B, and $6,734 at Series C+.
The LTV:CAC ratio is still the clearest single signal for efficiency. For B2B SaaS, 3:1 to 5:1 is the broadly accepted healthy range. The median B2B SaaS company now spends $2.00 on sales and marketing to acquire $1.00 of new ARR, while the blended CAC ratio drops to about $1.40 when expansion revenue is included.
Payback has stretched as well. The median for private B2B SaaS companies is now 18 months, up from 14 months two years earlier. Best-in-class teams still pay back in under 12 months, while publicly traded SaaS companies average about 7.4 months.
How business goals change what good PPC performance looks like
Business goals change the benchmark. Growth-led teams can live with longer payback. Cash-focused teams usually cannot. That means the business goal - not the market average - sets the target.
Venture-backed companies usually put about 47% of revenue into sales and marketing, while PE-backed firms tend to run closer to 33%. For cash-constrained or PE-backed teams, tighter payback windows and stronger first-year revenue efficiency matter more than raw pipeline volume. In that setup, the blended CAC ratio of about $1.40, which includes expansion revenue, is often more useful than the New CAC Ratio alone.
These targets set the standard for the channel benchmarks that follow.
CAC and CPL Benchmarks by PPC Channel
Channel costs are all over the map in 2026. The right way to judge them is by downstream CAC and payback, not just form-fill cost. A higher CPL can still make sense if it leads to faster pipeline or a higher ACV. So use these ranges as a gut check: can your paid mix still hit the CAC and payback targets from the previous section?
Channel benchmarks: Google Search, LinkedIn Ads, Meta, review sites, and content syndication

These ranges are directional. Don’t look at them on their own. Match them to deal size and sales motion.
| Channel | Typical CPL Range (USD) | Indicative CAC Range (USD) | Lead Quality & Intent |
|---|---|---|---|
| Google Search | $463 – $800+ | $802 | High intent; best for active evaluators. |
| LinkedIn Ads | $150 – $800+ | $982 | Strong firmographic targeting; best for higher-ACV offers. |
| Meta Ads | $142 – $230 | $230 | Lower cost, lower intent; better for broad awareness than complex sales. |
| Review Sites (G2/Capterra) | $120 – $350 | $300 – $600+ | Very high intent; buyers are actively comparing solutions and convert 22% better from MQL to SQL than average. |
| Content Syndication | $40 – $200 | $1,500 – $2,500+ | Top-of-funnel; requires significant nurturing before reaching closed-won. |
Google Search and LinkedIn usually fit higher-ACV deals best. Review sites bring in high-intent demand. Content syndication can stuff the top of the funnel with cheaper leads, but that low CPL can fool you. Once you account for the nurture cycle, its true CAC often comes in much higher than the headline CPL suggests.
That’s the heart of it: does the channel create enough qualified pipeline to earn its fully loaded CAC?
How to calculate CAC correctly for board reporting
For board reporting, use fully loaded CAC. That means media spend, agency fees, software, and allocated labor, divided by new customers.
Why does this matter? Because a channel can look cheap if you only count ad spend. Add in the rest of the costs, and the picture can change fast. Build the fully loaded number first, then stack it against the segment benchmarks from the previous section.
Paid acquisition efficiency red flags to watch for
One clear red flag is paid CAC rising above organic CAC without giving you faster pipeline or higher ACV. In B2B SaaS, paid CAC averages $341 versus $205 for organic. That gap is fine only when paid channels close faster or bring in larger contract values.
Another warning sign: a New CAC Ratio above $2.00 for companies with ACVs above $10,000. In that group, the benchmark is $1.50 or less.
These cost ranges mean little on their own. What matters is whether they turn into pipeline in an efficient way, which the next section covers.
Pipeline Yield and Funnel Conversion Benchmarks from PPC
Lead cost matters less than pipeline yield. Cost tells you if your spend is in line. These benchmarks tell you if the spend is turning into pipeline and revenue. The next step is simple: do those leads become SQLs, opportunities, and closed-won deals?
PPC funnel conversion benchmarks from visitor to closed deal
Conversion rates can swing a lot based on channel mix, ACV, and how tight your targeting is. So don't treat any single benchmark as a rule. Use the table below as a gut check for your own funnel.
| Funnel Stage | Average Rate | Top Quartile | Bottom Quartile |
|---|---|---|---|
| Visitor to Lead (PPC) | 1.0%–5.4% | 8.2% (Software Search) | 1.7% (Social Paid) |
| Lead-to-SQL | Varies by source | +22% lift via review sites | <15% (broad social) |
| SQL to Opportunity | 20%–30% | 35%+ (ABM-targeted) | <10% (unqualified sources) |
| Opportunity to Closed-Won | ~30% | 45%+ (referral/word-of-mouth) | <5% (cold outbound) |
Three patterns stand out.
First, paid search performance changes a lot by intent. Branded terms can hit 15% or more, generic terms often land around 10%, and competitor terms tend to come in closer to 4.5%. If you roll all three into one conversion rate, you blur the picture. It's like averaging apples, oranges, and coffee beans. You get a number, but not much insight.
Second, the Lead-to-SQL drop-off is where many teams quietly lose pipeline. High-intent sources like G2 and Capterra drive a 22% better Lead-to-SQL conversion rate than the average channel. That kind of lift can justify a higher CPL, because the lead is more likely to move forward.
Third, timing matters more than most dashboards suggest. In B2B SaaS, the average buyer journey in 2026 runs 272 days across 88 touchpoints. So a lead that looks stuck may just be moving through a long buying cycle. Not dead - just not ready yet. The stages that hit CAC efficiency and payback the hardest are Lead-to-SQL and SQL-to-Opportunity. If conversion slips at either stage, effective CAC climbs before the deal has any shot of closing.
Pipeline-to-spend ratios and pipeline coverage benchmarks
Once you know your funnel conversion rates, the next question is whether the pipeline volume is big enough to support the spend. This is where the pipeline-to-spend ratio comes in: how much sales-qualified pipeline each paid media dollar creates.
A healthy B2B SaaS business usually targets an LTV:CAC ratio of 3:1 to 5:1. In plain English, your active pipeline has to be strong enough to support that level of efficiency. If projected revenue falls short, one of two things is usually going on: coverage is too thin, or deal sizes are too small to make the PPC spend make sense.
High pipeline volume on its own doesn't solve the problem. Pipeline that never closes still takes time from sales and pushes realized CAC up. Thin coverage tends to show up later as slower payback.
That yield is what controls payback.
CAC Payback Trends and Next Steps for US B2B Teams
Payback expectations by channel and ACV tier
Once you know pipeline yield, the next check is payback. That’s what tells you whether paid acquisition works in cash terms, not just on paper.
The key 2026 benchmark is a median CAC payback period of 18 months, up from 14 months in 2024. That change matters. It means teams need to look harder at where budget goes and how long it takes to come back.
Branded search often shows strong ROAS on the surface - 10-20x is common. But the incremental picture is much weaker, with a median iROAS of only 0.3. In plain English, most of that revenue would have happened anyway. Among the channels cited here, LinkedIn shows the strongest ROAS at 121%, compared with 67% for Google Search and 51% for Meta. So branded campaigns should be treated as defensive infrastructure, not as performance channels.
Payback also changes a lot by deal size:
| ACV Tier | Median CAC (Paid) | Median Payback (Months) | Healthy Target Range | Red-Flag Threshold |
|---|---|---|---|---|
| SMB (<$10k ACV) | $300-$600 | 12 months | <10 months | >14 months |
| Mid-Market ($10k-$50k) | $1,800-$5,000 | 15 months | 10-12 months | >18 months |
| Enterprise ($50k+) | $7,000-$15,000+ | 18 months | 12-15 months | >24 months |
If payback goes past the red-flag threshold, move budget before adding more spend. Otherwise, you’re just pouring more dollars into a slower return cycle.
Actions for in-house teams and portfolio CROs based on the benchmarks
The benchmarks point to three clear moves.
First, review channel-level CAC every month, not every quarter. Branded, competitor, and generic campaigns do not perform the same way, and lumping them together can hide where efficiency is slipping.
Second, shift budget based on pipeline yield, not lead volume. A pile of form fills can look good in a dashboard and still do very little for revenue. The useful question is simple: which channels drive SQLs, and which ones just drive names into the CRM?
Third, fix MQL-to-SQL and SQL-to-opportunity leakage before scaling spend. Those handoff points are where effective CAC tends to creep up without much warning. More budget on top of a weak handoff doesn’t fix the issue - it just makes it cost more.
Conclusion: The 2026 B2B PPC Metrics That Matter Most
For 2026, efficiency comes down to CAC, pipeline yield, conversion quality, LTV:CAC, and payback. Clicks and CPL still matter, but they’re inputs, not the goal. For in-house teams and portfolio CROs, the job is simple: tie paid spend to pipeline and payback, not clicks.
FAQs
How do I calculate fully loaded CAC?
To calculate fully loaded CAC, add up all sales and marketing costs - not just ad spend - and divide that total by the number of new customers acquired during the same period.
That means pulling in both direct and indirect costs, such as:
- salaries and benefits
- tools, software, and engineering support
- agency and contractor fees
- content, design, digital PR, overhead, and training
Which PPC channels fit my ACV and sales cycle?
The right channel usually comes down to two things: your ACV and your sales cycle.
For high-ACV products priced above $10,000, LinkedIn is often the best fit. The reason is simple: its targeting makes it easier to get in front of decision-makers, which matters when you're dealing with long, complex sales cycles.
For lower-ACV products under $1,000, Meta or Google Search usually make more sense from a unit economics standpoint.
Google Search works best when you want to reach people who already have intent. It's a strong channel for existing demand from prospects who are actively looking for a solution.
What should I fix first if payback is too long?
If payback is more than 18 months, fix efficiency before you spend more on acquisition. If you don't, you'll just pour more money into problems that are already there.
Start with conversion rates. Then look at attribution, especially if last-touch is sending budget to the wrong channels. After that, audit lead quality and sales alignment. That includes sales velocity, intent-verified handoff, and a simple capacity check: can your team handle more lead volume before you scale?