If your Google Ads dashboard is slow, missing rows, or out of sync with GA4 or your warehouse, rate limits are a common cause. I’d boil it down to this: too many requests, poor retry handling, and uneven refresh timing can leave you with partial data, failed syncs, and KPI gaps that can run from 5% to 40%.
Here’s the short version:
- Daily quota limits can stop jobs after too many API operations
- Short-term throttling can slow or block jobs during busy windows
- Heavy queries can hit resource consumption limits even when row return is efficient
- Bad retries can turn one throttle event into a full retry loop
- Cross-platform reporting adds pressure because more systems need cross-platform ad performance tracking
- The fix is usually a mix of leaner queries, incremental pulls, backoff, concurrency caps, and clear freshness labels in dashboards
One point stands out: a single Search or SearchStream call counts as one API operation, but that does not mean every query is cheap. Large or segmented reports can still trigger throttling and slow the whole reporting flow.
If I were checking this in my own stack, I’d start with three things right away:
- Look for
RESOURCE_EXHAUSTEDandRESOURCE_TEMPORARILY_EXHAUSTEDin logs - Track
query_resource_consumptionto find the heaviest jobs - Split jobs by priority so hourly pacing reports don’t compete with backfills
In plain terms: rate limits are not just an API problem. They are a reporting reliability problem.
The article below explains where these failures show up, how to confirm rate limits are the cause, and what changes help keep data loading on time.
Ads DevCast E4: Managing your integrations at scale
sbb-itb-89b8f36
Common reporting problems caused by Google Ads API rate limits
In reporting, Google Ads API limits tend to show up in three ways: partial data, unstable jobs, and cross-platform KPI mismatches.
| Problem Type | Primary Cause | Typical Reporting Symptom |
|---|---|---|
| Incomplete Data | Quota exhaustion or throttling of expensive query patterns | Missing campaigns, ad groups, or date ranges in daily reports |
| Job Failures | Repeated retries and poor backoff logic during temporary throttling | Nightly syncs miss their morning SLA |
| KPI Mismatches | Different refresh times and different platform freshness windows | Discrepancies in spend, conversions, and ROAS between the Ads UI and unified dashboards |
Incomplete data and delayed dashboard refreshes
Once throttling kicks in, some parts of a report may still load while others don't. That leaves you with a partial report. Campaign totals might appear normal, but ad group breakdowns, search term data, or certain date ranges can be missing altogether.
For teams doing budget pacing checks or ROAS reviews, that's a serious issue. A refresh that runs into RESOURCE_TEMPORARILY_EXHAUSTED can leave the dashboard showing yesterday's numbers - or only part of the latest pull. Developer tokens with Basic Access are capped at 15,000 API operations per day, and that limit gets used up fast when you're querying many accounts, segments, and date ranges one by one.
And when short-term consumption limits are hit, there’s no quick fix. Users have to sit through forced cooldowns after throttling - 5 minutes for short-term limits and 30 minutes for long-term limits.
API errors, retry storms, and unstable ETL jobs
Bad retry logic can turn a short throttle into a full pipeline mess. The pattern is simple: a nightly sync hits a rate limit, retries right away, gets blocked again, retries again, and keeps looping until it burns through its retry budget or misses its SLA. That kind of retry storm makes things worse because it stacks even more requests onto an already strained quota.
A nightly ETL job that keeps retrying the same search term-level query can easily miss its morning SLA. By the time someone spots the issue, the reporting batch is stale and often needs a manual rerun.
Cross-platform KPI mismatches and reconciliation issues
The toughest issue is freshness drift across platforms. If the Google Ads API gets rate-limited in the middle of a refresh, its data freezes at one point in time while Meta or LinkedIn may keep updating. That’s where unified reporting starts to crack. One source stalls, the others move on, and the dashboard ends up mixing numbers from different moments.
This usually isn't a math problem. It's a freshness problem. Spend and conversion numbers in your BI tool can show a 5%–40% variance compared with the Google Ads UI, which then creates one more layer of mismatch against static warehouse data.
How to tell if rate limits are causing your reporting problems
Google Ads API Rate Limits: Reporting Jobs vs. Quota Load & Error Patterns
Before you redesign your pipeline, make sure rate limits are the actual problem.
RESOURCE_EXHAUSTED usually means you’ve burned through your daily quota. RESOURCE_TEMPORARILY_EXHAUSTED points to throttling from requests-per-second limits. You may also see more specific errors, such as QuotaError.EXCESSIVE_SHORT_TERM_QUERY_RESOURCE_CONSUMPTION and QuotaError.EXCESSIVE_LONG_TERM_QUERY_RESOURCE_CONSUMPTION. Those mean a certain query pattern is using too many resources.
That’s why logs, error codes, and quota trends are the fastest way to verify what’s going on.
Read logs, error codes, and request trends
Look for failures that show up at the same time every day. If a nightly sync keeps failing on schedule, that often means multiple jobs are starting together and pushing QPS limits too hard. Check request logs for clusters of failed calls during the same window. When those failures match other platform refreshes, shared scheduling is often the cause.
Also, log query_resource_consumption for every Search and SearchStream response. That number shows how expensive each report is, which makes it much easier to spot heavy queries before they trigger throttling. From there, you can sort jobs by load and see which ones are doing the most damage.
Map each reporting job to quota consumption
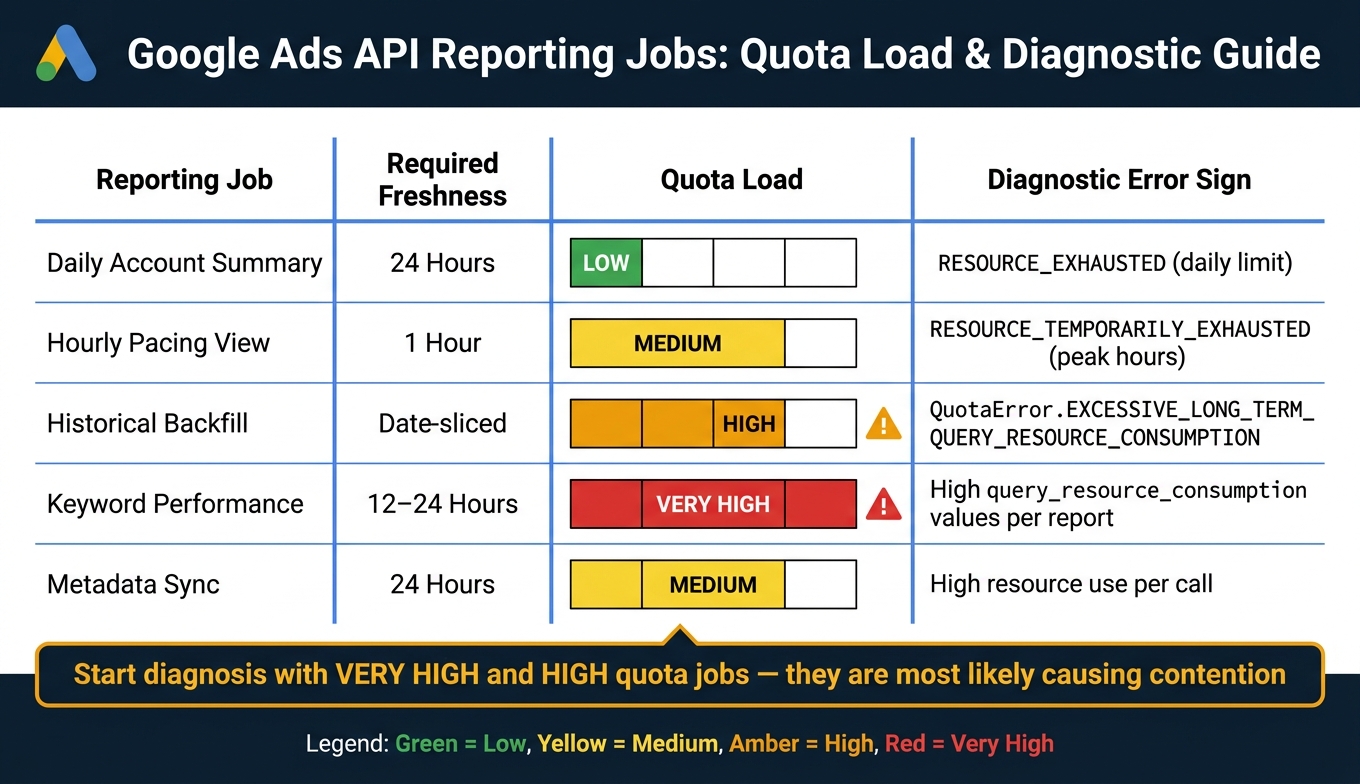
Not every reporting job hits quota the same way. Some are light and steady. Others are expensive enough to crowd out everything else.
The table below links common reporting jobs to their quota footprint and the error pattern you’re most likely to see when pressure builds:
| Reporting Job | Required Freshness | Granularity | Quota Load | Diagnostic Sign |
|---|---|---|---|---|
| Daily Account Summary | 24 Hours | Account Level | Low | RESOURCE_EXHAUSTED (daily limit) |
| Hourly Pacing View | 1 Hour | Campaign/Ad Group | Medium | RESOURCE_TEMPORARILY_EXHAUSTED during peak hours |
| Historical Backfill | Date-sliced | Segmented by Date | High | QuotaError.EXCESSIVE_LONG_TERM_QUERY_RESOURCE_CONSUMPTION |
| Keyword Performance | 12–24 Hours | Keyword + Segments | Very High | High query_resource_consumption values per report |
| Metadata Sync | 24 Hours | All Entity Fields | Medium | High resource use |
Start with the Very High jobs, then check the High ones. If those overlap with pacing jobs, quota contention is probably the issue. In practice, the heaviest jobs usually tell you where to look first in the next section.
Technical fixes that reduce reporting delays and failures
Start with the jobs that burn through the most quota, or consider using PPC bid management tools that handle these API complexities for you.
Cut API load with better GAQL queries and incremental pulls
Use these changes first on the jobs that use the most quota. The biggest win usually comes from incremental syncs. With change-event or change-status, you pull only objects that changed instead of reprocessing everything on every run. That alone can trim a lot of wasted API load. Pull only fast-moving metrics in frequent jobs, and keep static entity fields cached locally. Also, filter out removed records so you don't drag back rows you don't need.
For large reports, switch to GoogleAdsService.SearchStream instead of paginated Search calls. It cuts pagination overhead and makes large pulls less clunky. It also helps to combine related work into fewer, larger jobs rather than slicing the same dataset into a pile of small queries. Then process the results in memory.
If load is still too high, the next step isn't to throw more requests at the problem. It's to slow the flow in a controlled way. And when spikes still knock jobs over, keep retries in check instead of piling on more traffic.
Apply backoff, concurrency caps, and job tiers
After quota errors, don't retry right away. Start with a short delay, double it after each failure, and add jitter so requests don't all come back at once.
Backoff works best when paired with concurrency caps. Put a ceiling on total concurrent tasks, then move that limit up only when throughput proves it can handle more. Client-side rate limiters like token buckets or Guava RateLimiter can stop excess requests before they ever reach Google.
Job tiers help too. Not every report needs the same update speed. Keep the top-priority accounts on hourly refreshes, and update the rest once or twice a day.
Incremental loads usually save the most quota. Backoff and concurrency caps do a different job: they help keep freshness more stable when traffic jumps.
Even with throttling in place, some refreshes will still lag. That's why the dashboard itself needs to make freshness obvious.
Build dashboards that handle partial data freshness
Don't show stale data as if it's current. Mark it clearly. Add a "Last updated" timestamp for each data source, including Google Ads, GA4, CRM, and anything else feeding the report. If keyword-level data is behind, fall back to campaign-level totals. A simple status badge can give stakeholders a fast read on freshness without forcing them to dig through the report.
Long-term planning for scalable cross-platform reporting
Short-term fixes buy you breathing room. But if your reporting volume keeps growing, you need an setup that stops rate limits from turning into the same fire drill every few weeks.
Centralize data pipelines and quota governance
Once you've tightened queries and added retry controls, the next step is architectural: stop relying on direct API pulls for reporting by using marketing data pipelines. A warehouse-first architecture puts one collection layer between Google Ads and your dashboards. Raw data lands in a shared warehouse like BigQuery. That warehouse becomes the source of truth, while Google Ads and GA4 stay source systems. Dashboards and reports then query the warehouse instead of hitting the API every time.
This cuts duplicate API pulls in a big way. Manager-account (MCC) transfers can batch many accounts into one job, which helps reduce repeat API calls.
The other piece is governance. If nobody sets rules, quota gets burned by the wrong jobs at the wrong time. Set priority rules for quota-heavy workloads during peak refresh windows. Use the query_resource_consumption field in API responses to see which reports cost the most, then move those jobs to off-peak hours.
Use specialized PPC resources when in-house reporting is stretched
Sometimes the problem isn't strategy. It's bandwidth.
If your internal team is stretched, outside PPC support can help keep reporting workflows on track. If in-house capacity is limited, Top PPC Marketing Directory can help teams find PPC tools, agencies, and services with reporting experience. When you're weighing options, focus on partners that use incremental data pulls, MCC-level transfers, and warehouse-first storage.
Conclusion: Key lessons for reliable reporting
Rate limits don't just slow dashboards down. They can leave holes in your data and create KPI mismatches across platforms.
The route to dependable reporting comes down to four connected moves:
- Diagnose issues with logs and job mapping
- Cut API load with GAQL tuning and incremental pulls
- Steady delivery with backoff and scheduling
- Govern quota at the pipeline level
Teams that treat this like one connected system, not a pile of one-off fixes, usually end up with reporting they can rely on.
FAQs
How do I know if rate limits are causing missing report data?
Check for errors like RESOURCE_TEMPORARILY_EXHAUSTED or QuotaError.EXCESSIVE_QUERY_RESOURCE_CONSUMPTION. Those often mean API limits are affecting your report data.
Also watch for longer wait times or throttling messages. That usually means your requests are being limited.
Which Google Ads queries are most likely to trigger throttling?
Requests that pull large reports, run broad or complex searches, or ask for a lot of data across many accounts are the most likely to hit throttling.
That risk goes up when those requests use too many API resources or push past rate limits.
What is the best way to keep dashboards accurate during sync delays?
Cache data locally, then fetch updates only when needed. A simple way to do that is to use change-event and change-status reports to spot what changed since the last sync. That cuts down on API calls and helps keep data in sync.
It also helps to batch requests instead of sending them one by one. Plan refreshes for off-peak hours, use exponential backoff with jitter when retries happen, and monitor sync issues so teams can spot and fix discrepancies fast.